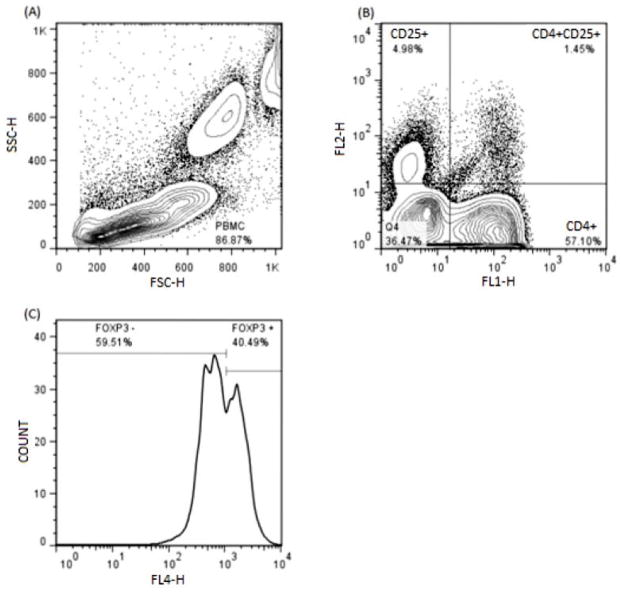
Figure 2.
(A) – Identification of CD4+CD25+FOXP3+ regulatory T cells by three color flow cytometry approach. RBC- depleted canine cells were gated based on their relative size and granularity using forward and side scatters.
(B) – Two color analysis for the CD4+CD25+ T cells was performed by using dot plots with quadrant statistics.
(C) – The FOXP3 staining intensity was analyzed by using single histogram statistics.

