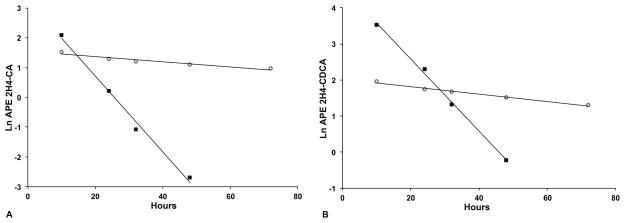
Figure 1.
Representative bile acid kinetic studies of low-GGT PFIC subjects with PEBD and LTX. CA (panel A) and CDCA (panel B) kinetics for Subject 3 with PEBD and Subject 7 with LTX are shown. Measurements (In APE values) at each time point are represented as closed squares for Subject 3 and open circles for Subject 7. Linear regression analysis determined the line of decay of plasma concentration of stable isotope labeled CA and CDCA plotted as lnAPE versus time (hours). Because of the rapid decay of labeled bile acids in PEBD subjects, the regression lines were extended only to the point where reliable measurement could be made.

