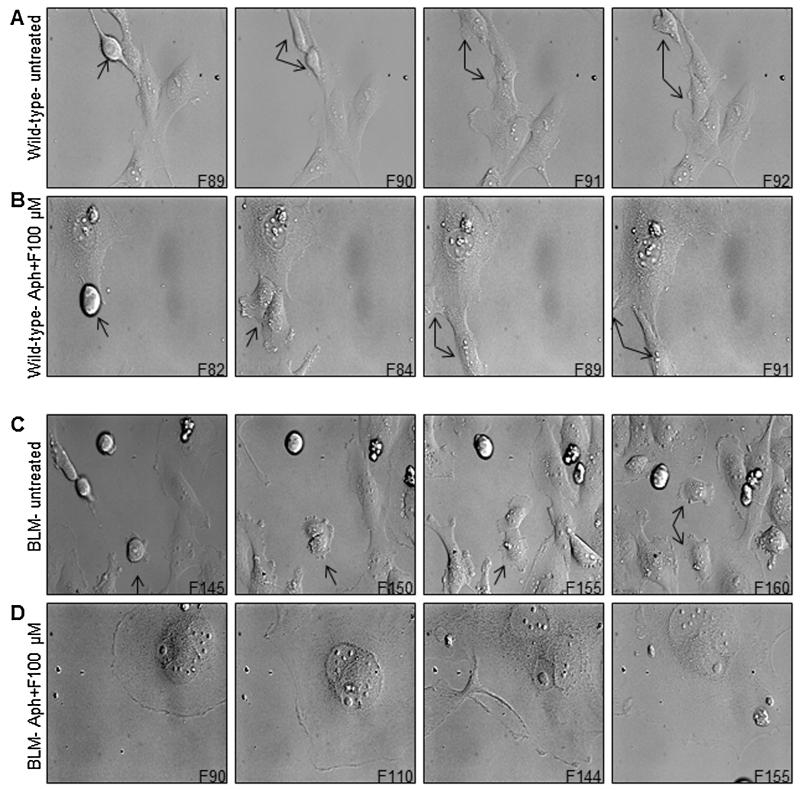
Fig. 3.
Snapshot images from a time-lapse experiment showing mitotic cell division defects in formaldehyde-treated BLM-deficient cells. Untreated wild-type or BLM-deficient (A, C) cells are compared to S phase synchronized and formaldehyde-treated cells (B, D). Synchronized cultures were released from aphidicolin (24 h treatment), and 2 h later, treated with formaldehyde (100 μM for 4 h). Images were captured at 30 min intervals for 6 days. “F” followed by a number in the right corner of each image represents the frame number from the time-lapse movie. Arrows indicate dividing cells.

