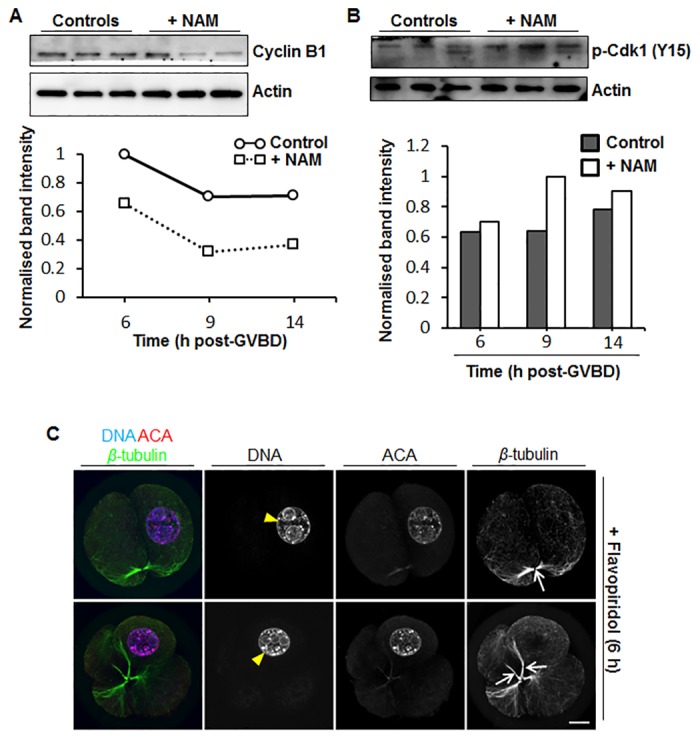
Fig 7. Effect of NAM treatment on cyclin B1 and p-Cdk1 levels and of flavopiridol treatment at 6 h post-GVBD.

(A) Western blot of cyclin B1 and actin in control and NAM-treated oocytes at 6 h, 9 h and 14 h post-GVBD (30 oocytes per sample; shown is a representative blot of 3 replicates). Band intensities from Westerns were quantified and normalised against the maximal intensity at 6 h post-GVBD and plotted as a graph. (B) Western blot of p-Cdk1 and actin in control and NAM-treated oocytes at 6 h, 9 h and 14 h post-GVBD (30 oocytes per sample; shown is a representative blot of 3 replicates). Band intensities from Westerns were quantified and normalised against the maximal intensity at 9 h post-GVBD in NAM-treated oocytes. (C) GV-stage oocytes were cultured in vitro in standard medium till 6 h post-GVBD and were then transferred into medium containing 5 μM flavopiridol for 20 h before being fixed and immunostained. Shown are representative confocal images of oocytes immunostained for chromosomes (DNA), kinetochores (ACA), and spindle microtubules (β-tubulin). Note that oocytes have either divided into two (top panel) or four (lower panel) similarly sized cells that remain connected via central spindles (white arrows). Note also that chromatin has decondensed and occurs within a nuclear structure (white arrowheads) but that all DNA is retained within one cell. Scale bars = 10 μm.
