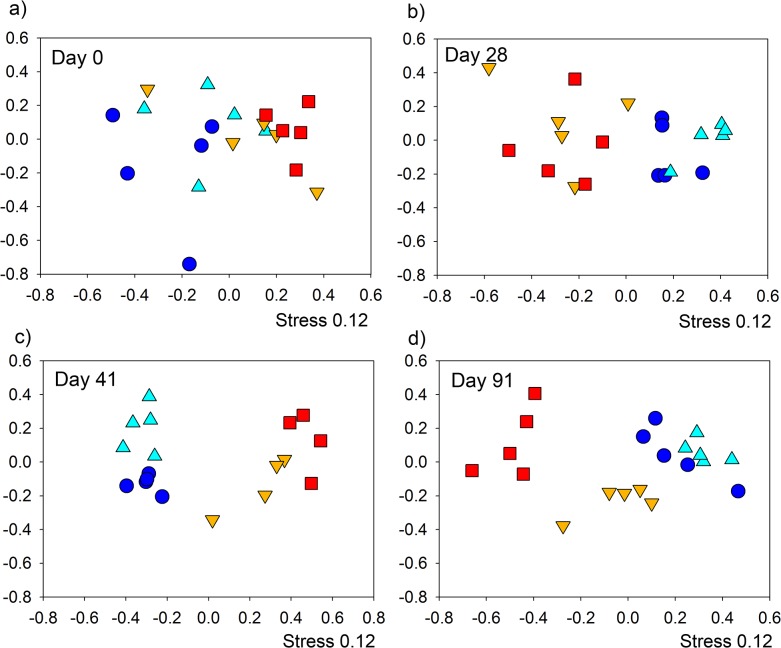
Fig 6. NMDS analysis of bacterial communities in stool samples assessed by 454 pyrosequencing at individual time-points:
Comparisons were made between the groups Naïve, naïve antihelminthic treated, infected antihelminthic treated and Infected, in order of dark blue, light blue, orange, red. a) Day 0 there were no significant differences, b) day 28 & c) day 41, naïve and naïve antihelminthic treated were significantly different to infected and infected antihelminthic treated (p < 0.0083), D91 all significantly different (p < 0.0083). Axis represent scale for Euclidian distance between samples centred on zero, Stress indicates the quality of fit of data (>0.2 is a good fit).

