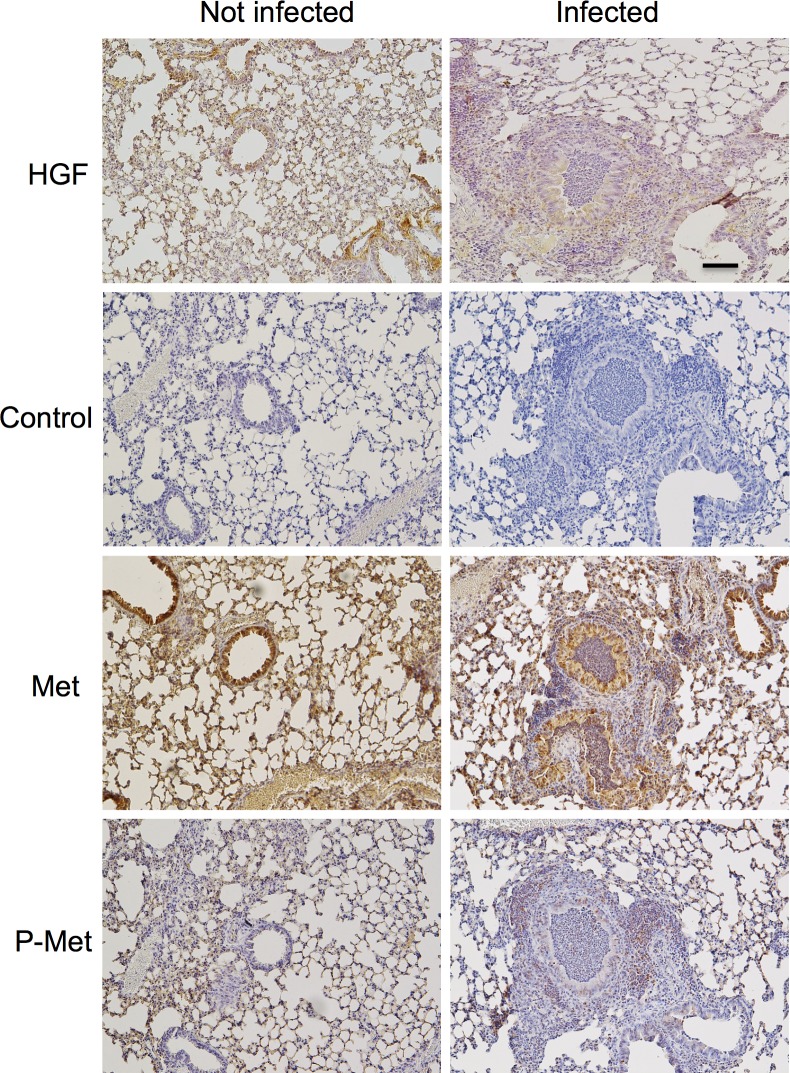
Fig 5. Lung and airway expression of HGF and HGF receptor c-Met.
Representative low-power images of lung sections were obtained from sham-infected mice (left panels) or from mice 7 days after initial infection with M. pulmonis (right panels) after immunostaining for HGF, c-Met or activated phospho-c-Met. Control sections were stained like the other sections but with omission of primary antibody. Scale bar = 100 μm.

