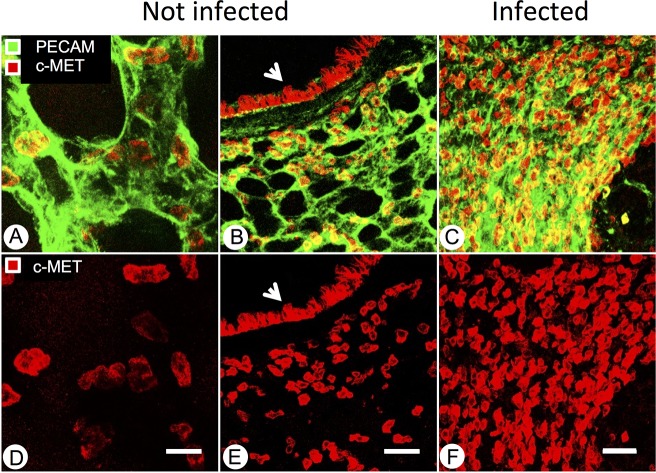
Fig 6. Localization of c-Met expression by confocal immunofluorescence microscopy in pathogen-free and mycoplasma-infected lungs.
A: representative image of endothelial cell (green, PECAM-1) and c-MET (red) staining of alveoli in a pathogen-free mouse. Scale bar = 20 μm. B: Representative image of PECAM-1 (green) and c-Met (red) staining in lung section of a pathogen-free mouse. Airway epithelium is marked by an arrowhead. Scale bar = 50 μm. C: representative image of PECAM-1 (green) and c-Met (red) staining in lung section of a 7-day M. pulmonis-infected mouse. Scale bar = 50 μm. D, E, and F: c-Met staining only, corresponding to A, B, and C, respectively.

