
Fig 10. The molecular network of SMI treatment via IPA.
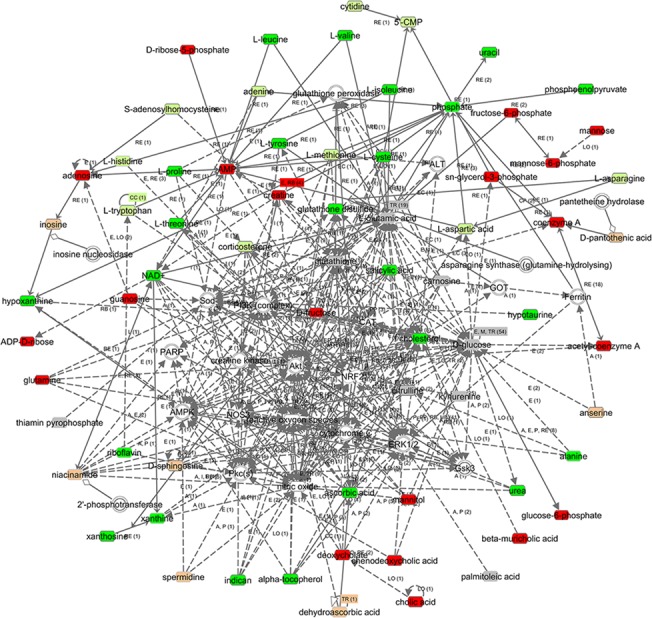
The metabolites are represented as colored nodes. The red nodes represent the significantly upregulated metabolites; the light red nodes represent the modestly upregulated metabolites; the green nodes represent the significantly downregulated metabolites; the light green nodes represent the modestly downregulated metabolites, and the gray nodes represent the unchanged metabolites. The transparent entries were molecules from the Ingenuity Knowledge Database. The biological relationship between two nodes is represented as a line. A solid line indicates a direct physical relationship between the corresponding molecules, whereas a dotted line indicates an indirect functional relationship.