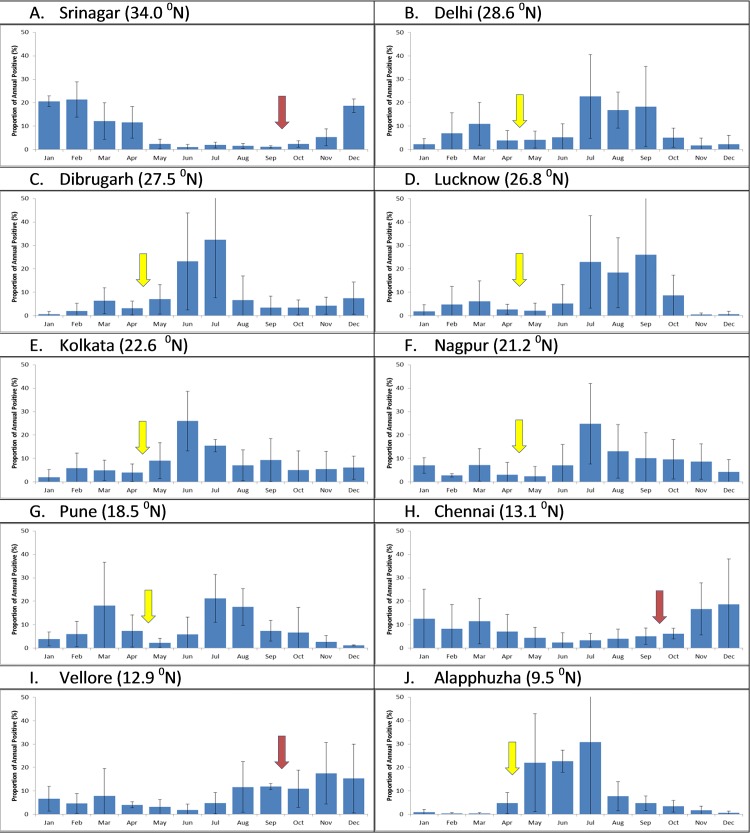
Fig 2. The proportion of influenza virus positivity by year (2009–2013) in India.
Cumulative data on monthly distribution of influenza viruses by city was calculated (data shown is Mean± 1 SE). For this analysis, data from 2009–2010 was excluded due to the pandemic which did not follow the usual seasonality pattern. Arrow indicates proposed vaccination timing during September-October (red arrow) or April-May (yellow arrow). The latitude for the capital city of each country is shown on the top of each panel.

