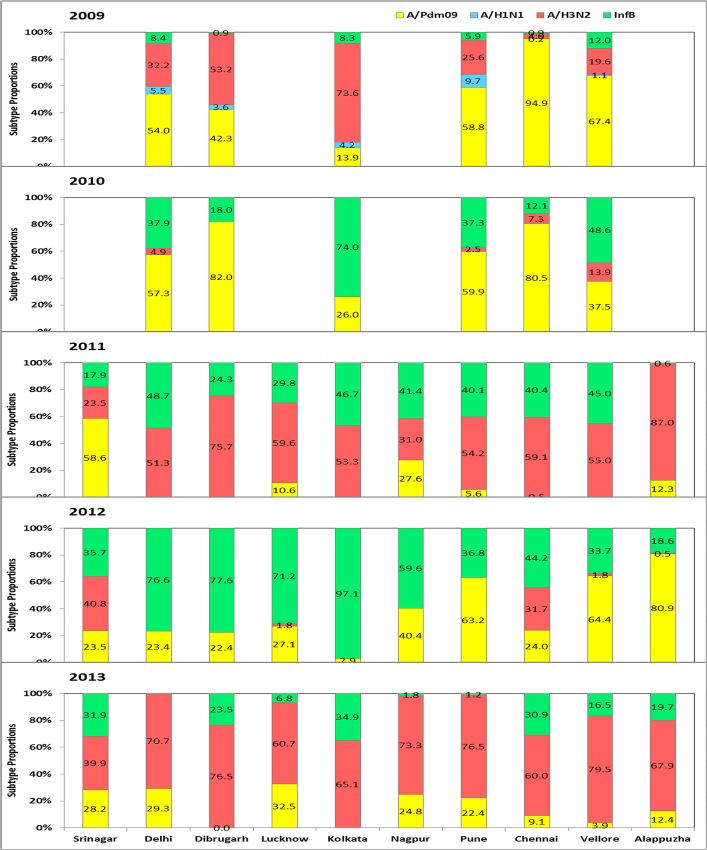
Fig 3. Influenza virus type and subtype distribution by year and city.
The overall % positivity of types and subtypes is shown for each city. The left axis shows the percent monthly distribution of seasonal influenza A/H1 (blue); A/H3 (red), influenza B (green) and pandemic A/H1N1pdm09 (yellow) from 2009 to 2013.

