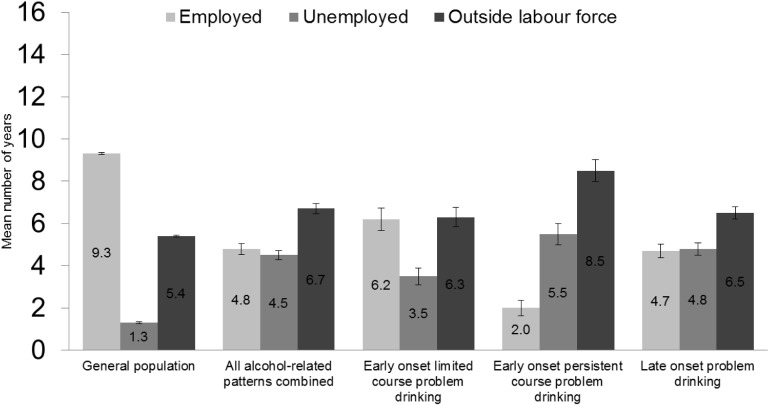
Fig 1. Average number of years employed, unemployed, and outside the labour force over the 16-year follow-up period by retrospectively defined patterns of problem drinking.
Means adjusted for cohort, sex, and age at the time of death/end of follow-up. Error bars represent the 95% confidence intervals. Finnish men and women aged 18–34 years.

