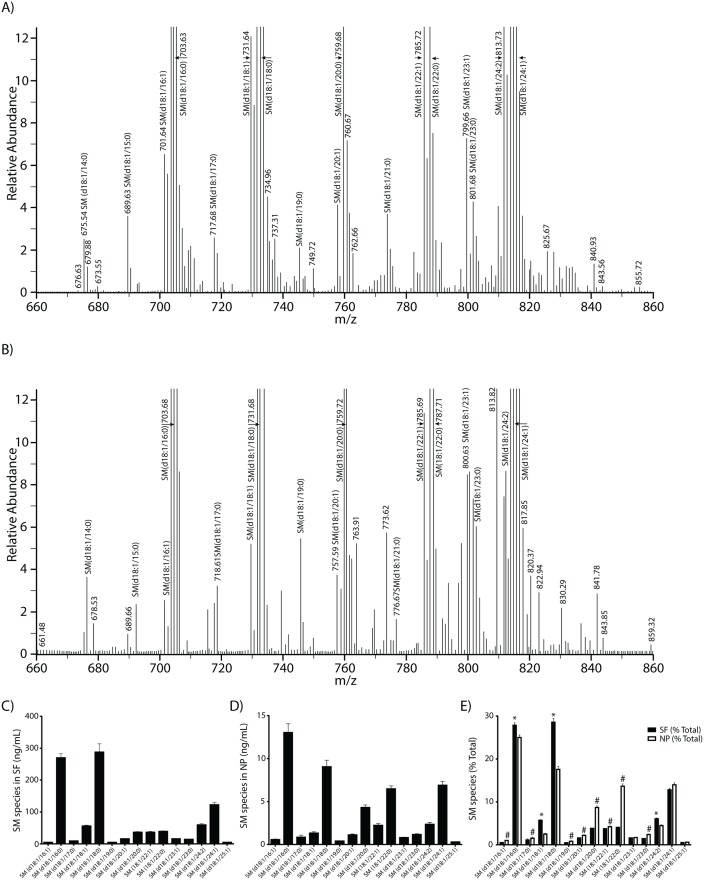
Fig 2. Spectra and levels of sphingomyelin species.
SM species from LC-MS/MS were processed using the spectral feature of the Qual Browser software. Fig 2 shows representative spectra of SM species identified in SF (2A) and NP (2B). Amounts of 15 SM molecular species were determined in SF (2C) and NP (2D) and expressed as a percent of total in each CSF fraction (2E). The P values were obtained using a paired t-test. The asterisk (*) on Fig 2E denotes SM species whose proportions are higher in SF than NP (P < 0.05) and # denotes SM molecular species whose proportions are higher in NP than SF (P < 0.05). The unmarked species have similar proportions in both fractions (P > 0.05). These data are the mean ± SEM for SF (n = 70), and NP (n = 67).

