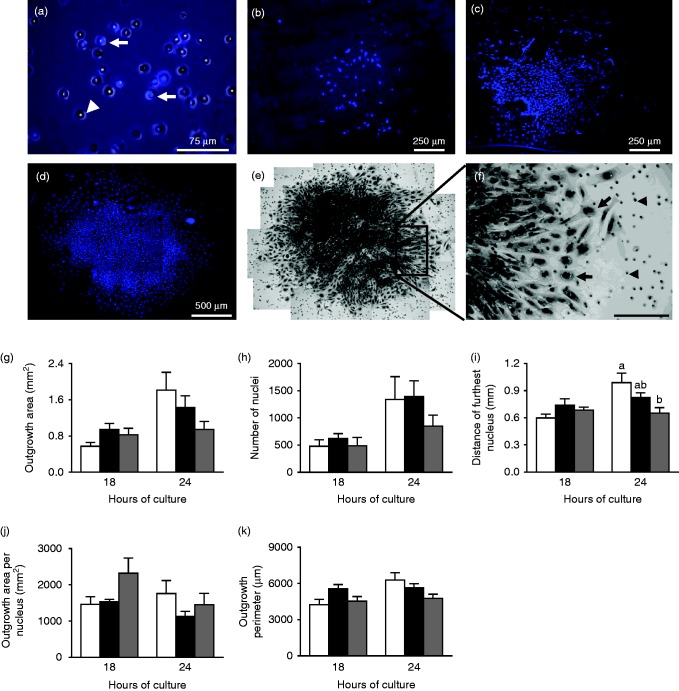
Figure 4.
(a) High-magnification image of a DAPI-stained Transwell invasion chamber showing cells migrating (arrows) though the 8 μm membrane pores (arrow head) after 6 h in culture. (b) Lower magnification image of a DAPI-stained Transwell invasion chamber after 6, (c) 12 and (d) 18 h of culture. (e) Haematoxylin-stained outgrowth after 18 h of culture. (f) Magnified section showing large, multinucleated peripheral cells (arrows) and 8 μm pores (arrow heads). (g, h, i, j and k) Mean EPC outgrowth measurement from NPD (white bars), LPD (black bars) and Emb-LPD (grey bars) explants grown on Matrigel invasion transwell inserts after 18 and 24 h. n=6–7 outgrowths per culture time and treatment group, taken from 6–7 separate females per diet. Error bars are s.e.m. Different letters denote statistical significance between groups at P<0.05.

 This work is licensed under a