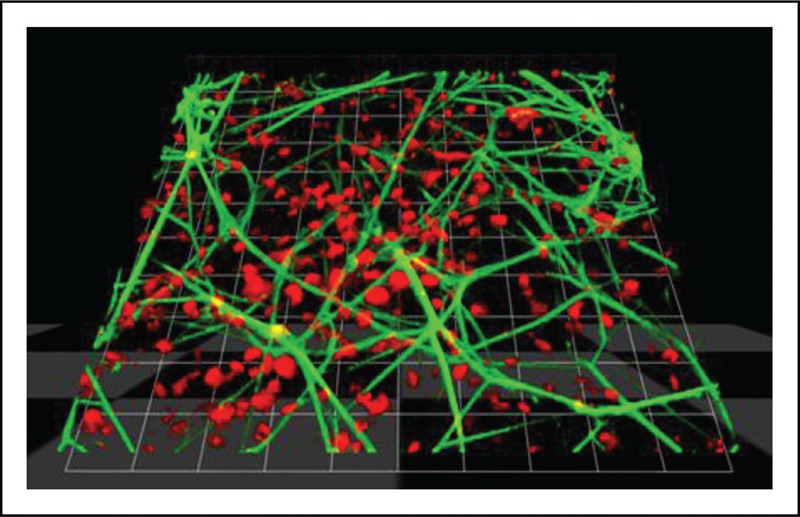
FIGURE 2.

Confocal imaging of clot formation. 3D visualization of a human blood clot: fibrin (light grey) was visualized via the detection of a fluorescein isothiocyanate-conjugated antifibrinogen antibody [3] added prior to the initiation of the coagulation process (star-tem/ex-tem). Platelets (dark grey) were stained using a fluorescently labeled wheat germ agglutinin [Real-time live confocal microscopy of a human blood sample stained with TMRM (light grey) and WGA (dark grey)]. The image was acquired by live confocal microscopy using an inverted microscope (Zeiss Observer.Z1; Zeiss, Oberkochen, Germany) in combination with a spinning disc confocal system (UltraVIEW VoX; Perkin Elmer, Waltham, MA). 1 Unit = 10.21 μm; objective: 63 × oil immersion, NA 1.42.
