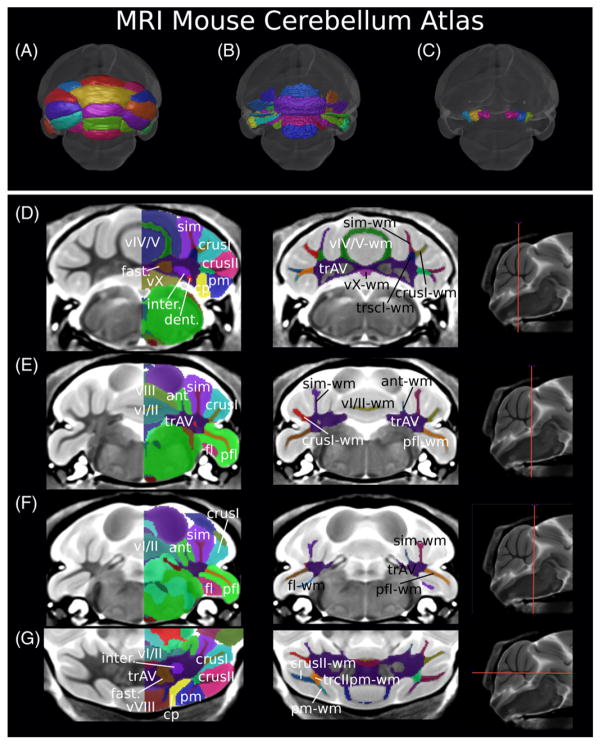
Figure 1.
The magnetic resonance imaging MRI mouse cerebellar atlas. A, B, and C represent surface renderings illustrating the cortical surface, white matter surface, and deep cerebellar nuclei, respectively. D, E, and F are coronal slices with labeled structures, gray matter structures labeled on the left column, and white matter structures labeled on the right (with the exception of the arbor vita trunk, labeled in both columns). G is a transverse slice with gray matter structures labeled in the left image and white matter structures in the right. The colors are distinct for each label; therefore, structures with a right and left label will be colored differently depending on the side of the brain. For the left column, only one side is labeled and colored so the underlying MRI contrast can be seen.

