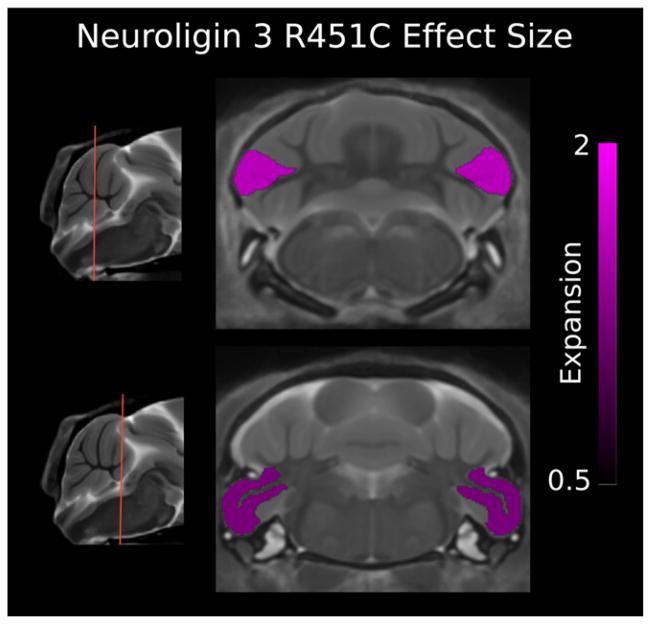
Figure 2.
Two coronal slices of the Neuroligin-3 R451C (NL3 KI) mouse model compared with wild type (WT) showing the effect size of each significant false discovery rate < 5%) cerebellum structure. The paraflocculus gray matter and crus II gray and white matter are bilaterally larger in volume. A positive effect size represents an expansion of the region in the NL3 R451C mouse relative to controls (volumes have been normalized by total brain volume).

