
Fig. 6.
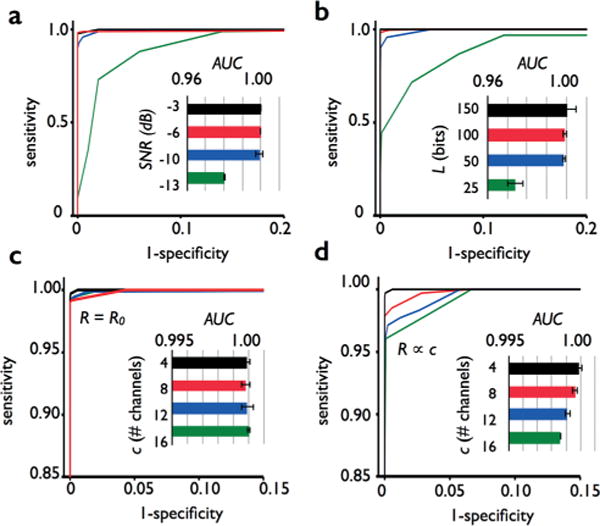
Characterizing the effect of design parameter choices on performance. The effect of various design parameters on sensitivity and specificity of droplet detection were characterized using a model system. The results were summarized by a receiver operator characteristic (ROC) curve and quantified by the curve’s area under the curve (AUC). a. The AUC remains unchanged as the signal to noise ratio (SNR) is dropped to as low as −10 dB (0.1), but then falls precipitously below −13 dB (0.05). b. The AUC remains unchanged as the number of bits in the mask (L) was dropped as low as L = 100, but then begins to fall off below L = 50. c. The AUC is unaffected by increasing the number of channels as high as c = 16, when the total droplet rate is held constant R = R0, leading to an average of one droplet in the detection region at a time. d. When the droplet rate is increased proportionally with the numbers of channels R ∝ c, the AUC begins to fall as the average number of droplets in the detection region becomes greater than two.