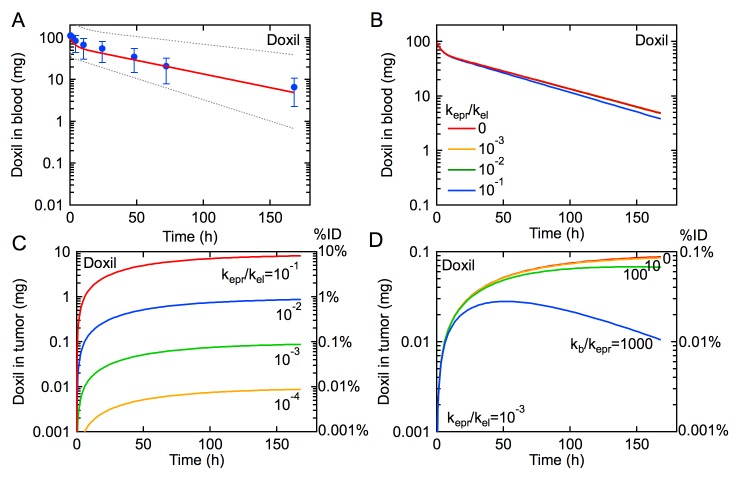
Fig 2. The influence of the EPR effect on the rate of tumor uptake of Doxil for an administered dose of 100 mg (50 mg m-2).
(A) Pharmacokinetics for Doxil. Symbols are data from a clinical trial reported by Gabizon et al. [12]. The solid red line is obtained from our model using values for kp, kd, and kel derived from median values of A, B, α, and β reported by Gabizon et al. (Table 1) [12], where kel ~ k10 when kel >> kepr. The dotted lines represent the pharmacokinetics for the minimum and maximum values of A, B, α, and β. (B) Simulations of the pharmacokinetics for Doxil with kepr/kel = 0, 10–1, 10–2, and 10–3, and kb = 0. (C) Amount of Doxil in tumor for kepr/kel = 10–1, 10–2, 10–3, and 10–4, and kb = 0. (D) Amount of Doxil in tumor for kepr/kel = 10–3 and kb/kepr = 0, 10, 100, 1000. The amount of Doxil in tumor represents the total amount of doxorubicin.

