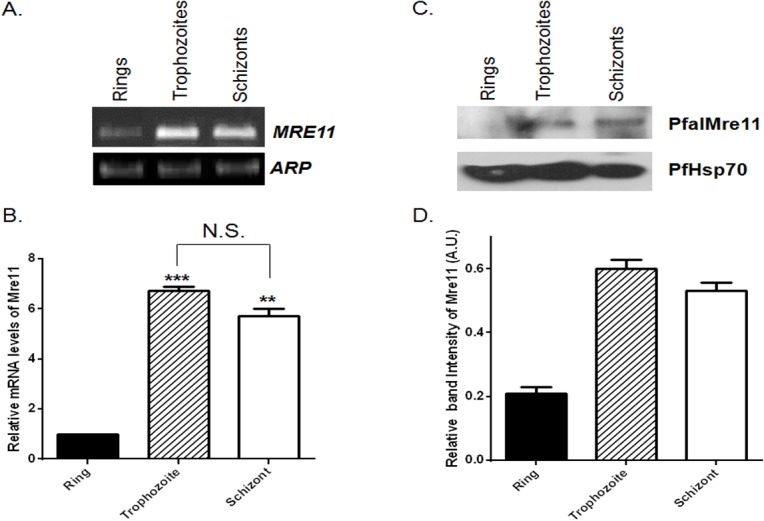
Fig 2. Developmentally regulated expression of PfalMre11 during blood stage development.

(A). Semi-quantitative RT-PCR showing expression of PfalMRE11 mRNA at the ring, trophozoite and schizont stages. PfARP was used as the loading control. (B). Relative abundance of PfalMRE11 transcript measured by real-time RT-PCR analysis. Data were normalized against PfARP. The mean values ± SD from three independent experiments are plotted. (C). Stage specific expression of PfalMre11 protein. The stages are marked on the top. PfHsp70 was used as the loading control. (D). The quantification of Western blots from three independent experiments. Data was normalized against the loading control PfHsp70. Each bar represents mean density ± SD. The P value was calculated using the two-tailed Student’s t-test (** means P <0.01; *** means P <0.001; N.S. means not significant).
