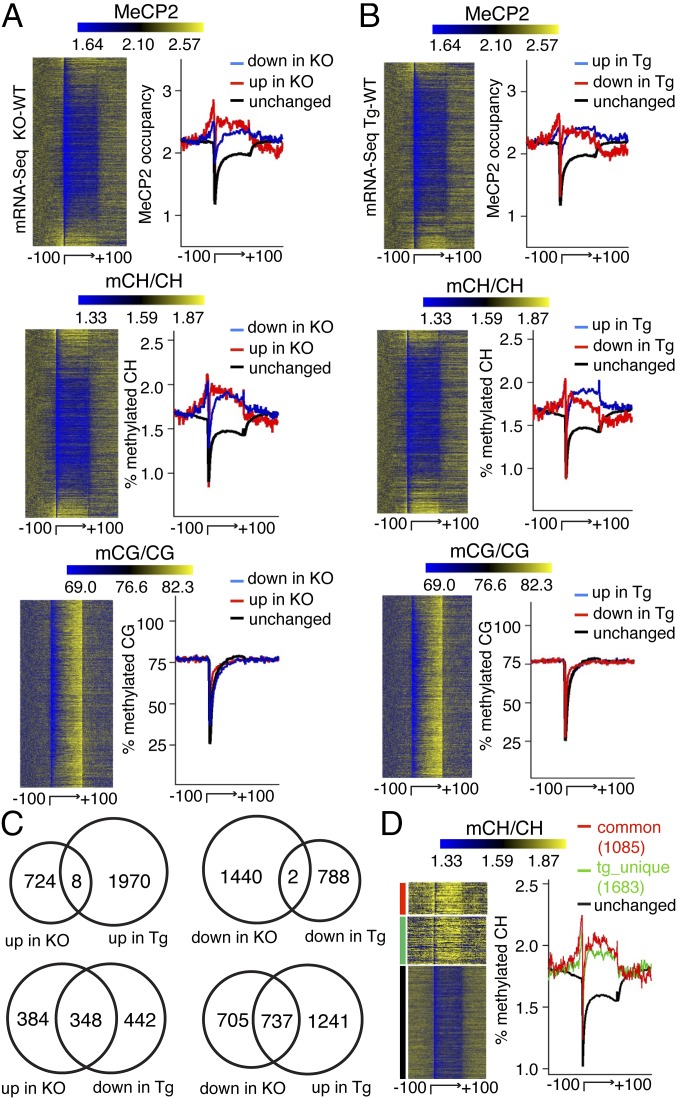
Fig. 4.
MeCP2 binds mCH to influence transcription in the adult mouse brain. (A) Heatmap representation of MeCP2 binding, mCH and mCG in the gene body, and the flanking 100 kb for all mouse genes, ranked by mRNA expression changes in the adult MeCP2 knockout (KO) brain compared with wild-type (WT) and presented from top to bottom in ascending order (from most down-regulated to most up-regulated). Right panel of each heatmap shows quantitative profiles. Chart depicts up-regulated genes (red), down-regulated genes (blue), and unchanged genes (black) in MeCP2 KO brain. (B) Same as in A except that the data are ranked by mRNA expression changes in the adult MeCP2 transgenic (Tg) mouse brain compared with wild-type and presented from top to bottom in ascending order (from most down-regulated to most up-regulated). Chart depicts up-regulated genes (blue), down-regulated genes (red), and unchanged genes (black) in MeCP2 Tg adult mouse brain. (C) Transcriptional changes in MeCP2 KO and Tg adult mouse brain compared with their corresponding WT. (D) Heatmap representation of flank-normalized mCH in genes with inverse expression changes in both MeCP2 mutants (red); a subgroup of uniquely misregulated genes in MeCP2 Tg animals (green); and those genes that are unchanged (black). Right panel shows quantitative profiles. Signal values in heatmap and average plot are normalized so that the mean signal value in flanking regions of each gene will be the same in A, B, and D.

