Fig. 3.
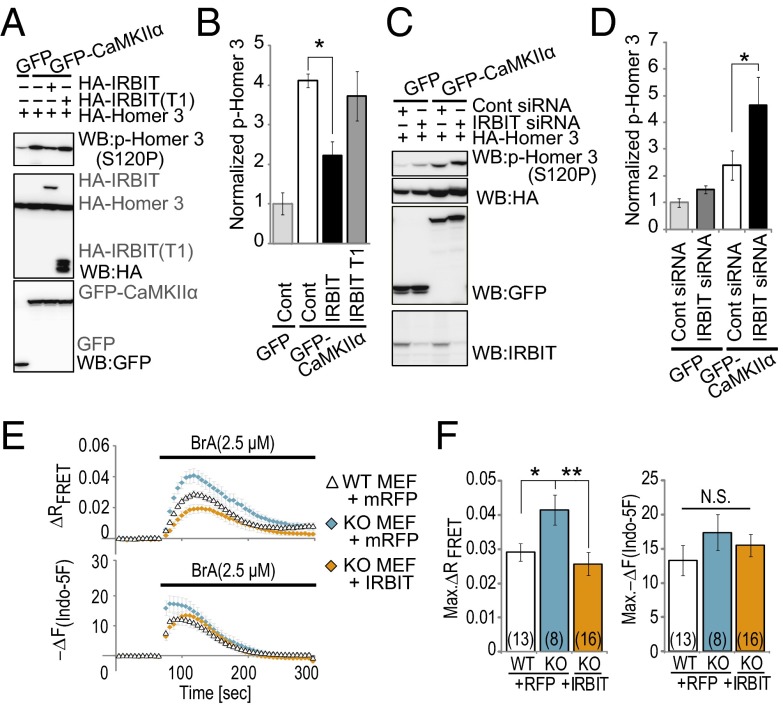
IRBIT suppresses the CaMKIIα kinase activity in living cells. (A) IRBIT overexpression inhibited phosphorylation of Homer 3. GFP or GFP–CaMKIIα cells were transfected with HA–Homer 3 and HA–IRBIT or HA–IRBIT (T1, 1–104). After 24 h, cells were stimulated with 2.5 μM BrA for 2 min. (B) Quantitative analysis of phospho-Homer 3 in Fig. 3A. n = 3. (C) Phosphorylation of Homer 3 was enhanced in IRBIT knock-down cells. GFP–CaMKIIα cells were transfected with HA–Homer 3 and control siRNA or IRBIT siRNA. After 48 h, cells were stimulated with 2.5 μM BrA for 2 min. (D) Quantitative analysis of phospho-Homer 3 in Fig. 3C. n = 4. (E) Simultaneously imaging of FRET and Ca2+ change in IRBIT WT or KO MEF cells transfected with mRFP or IRBIT/mRFP. (Upper) Representative FRET changes are shown. (Lower) Representative Ca2+ responses (indo-5F) are shown. (F) Quantitation of FRET and Ca2+ peak amplitude. Peak amplitude FRET (Max. ΔR FRET) and Ca2+ responses [Max. −ΔF(Indo-5F)] that were expressed as the averaged amplitude of 0–50 s are equal to zero. Results show three independent experiments. The total cell numbers are indicated in each graph.

