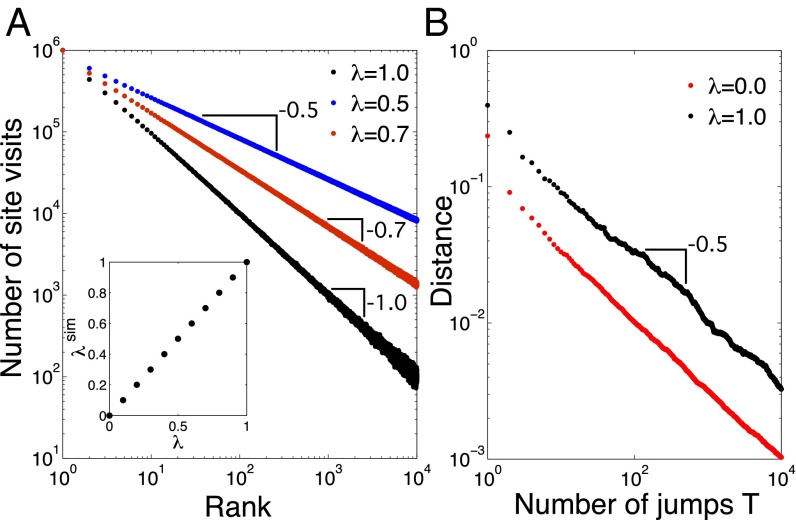
Fig. 3.
(A) Rank distributions of SSR processes with iid noise contributions from simulations of Φ(λ)∞, for three values of λ = 1, 0.7, and 0.5 (black, red, and blue, respectively). Fits to the distributions [obtained with a maximum-likelihood estimator (24)] yield λfit = 0.999, λfit = 0.699, and λfit = 0.499, respectively. Clearly, an almost exact match with the expected power-law exponents is realized. The inset shows the dependence of the measured exponent λsim from the simulations (slope), on various noise levels λ. The exponent λsim is practically identical to λ. N = 10,000, numerical simulations were stopped after M = 106 restarts of the process. (B) Convergence rate. The distance (2-norm) between the simulated occupation probability (normalized histogram) after T jumps in the Φ(λ)∞ process, and the predicted power-law of Eq. 6, is shown for λ = 1 (black), and the pure random case, λ = 0 (red). Both distances show a power-law convergence ∼T−β. MLE fits yield β = 0.512 and 0.463, for λ = 0 and 1, respectively. This means that both cases are compatible with β ∼ 1/2, and that SSR processes converge equally fast toward their limiting distributions as pure random walks do.

