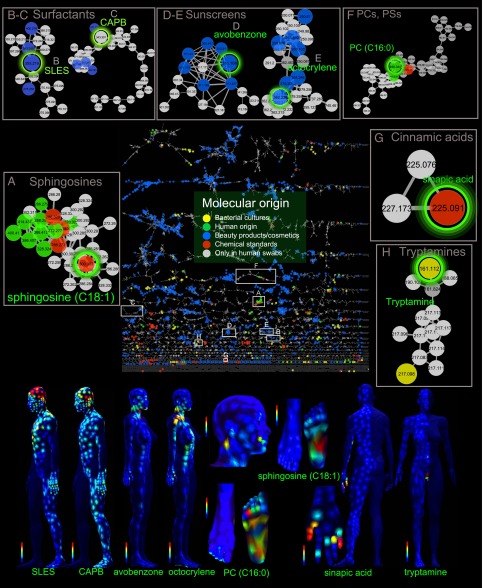
Fig. 2.
Structural biochemical analysis driven by topographical maps reveals molecules from various molecular families. The molecular features were selected based on their biogeographical localization as shown on the maps. The structural analysis was performed using molecular networking of UPLC-QTOF MS/MS data. The full network is shown in the middle; a node corresponds to a consensus MS/MS spectrum, and an edge represents the similarity between MS/MS spectra. The thickness of the edges (gray lines connecting nodes) indicates the level of similarity. Network has been generated using a cosine of 0.65 and then imported and visualized in Cytoscape. Subnetworks show examples of molecular families (A–H). The network nodes were annotated with colors showing molecular origin, and larger nodes highlight molecules coming from different known origins. CAPB, cocamidopropyl betaine; PC, phosphocholine; PS, phosphoserine; SLES, sodium lauryl ether sulfate. See also Figs. S2–S5.

