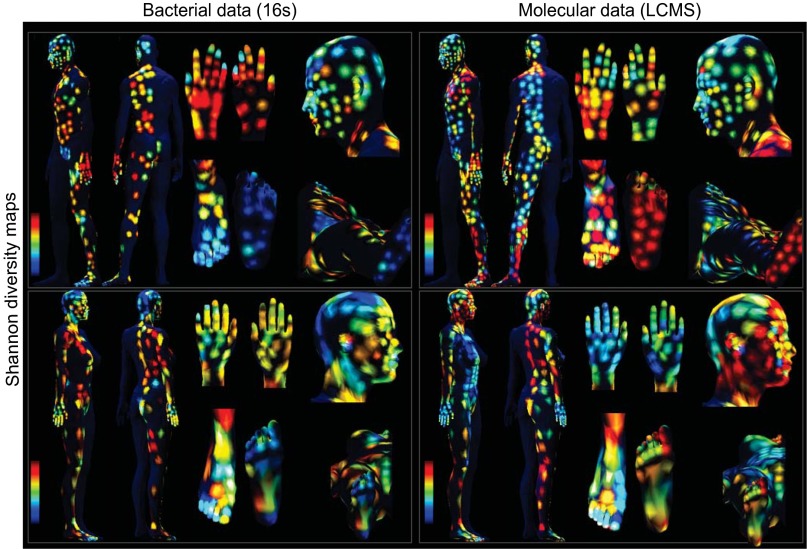
Fig. 4.
Representation of the microbial and molecular diversity using the Shannon index, comparing samples based on their microbial (16S rRNA amplicon) or molecular (UPLC-QTOF-MS) profiles. The Shannon diversity maps showing values of the Shannon index calculated for each sample separately from microbial (16S) and molecular (UPLC-QTOF) collections. Both molecular and microbial diversity is displayed for each volunteer, separately, highlighting regions of high and low diversity on the skin surface. For the color scale, blue corresponds to the minimum value of the Shannon index for the individual and red corresponds to the maximum value.

