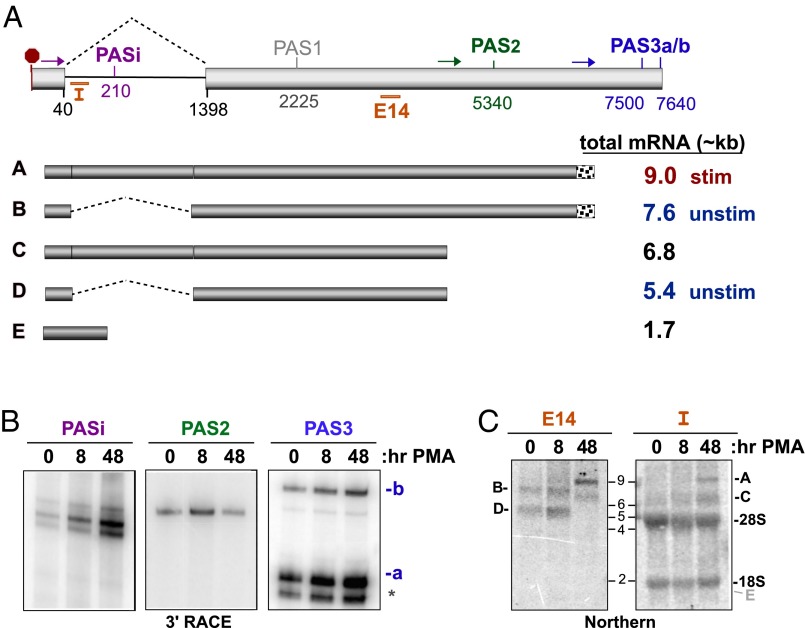
Fig. 4.
Alterations in CELF2 3′UTR expression correlate with changing mRNA stability. (A) Schematic of the exon 13–14 region that comprise the 3′UTR of CELF2. (Upper) Light gray boxes are exons, line is intron. Numbers indicate position of splice sites or Ref-Seq described putative PAS relative to the translation stop codon (red octogon). Colored arrows indicate position of primers used in 3′ RACE to detect the four PAS sites observed in JSL1 cells (PASi, PAS2, PAS3a, PAS3b). Orange bars indicate position of Intron (“I”) or exon 14 (“E14”) probes used for Northern blots. (Lower) Schematic of the five 3′UTRs for which there is experimental evidence in JSL1 cells and approximate size of the corresponding complete mRNA. Predominant forms in unstimulated and stimulated Jurkat cells are indicated. Note that mRNAs using PAS3a and PAS3b are grouped together as these sites are in close proximity and are not easily distinguished by Northern blot. (B) 3′ RACE analysis of PAS utilization in the endogenous CELF2 gene in unstimulated (0 h PMA) or stimulated (8 or 48 h PMA) JSL1 cells. Oligo-dT reverse transcription extension was amplified using the primers shown in A (see Materials and Methods). Primers immediately upstream of PASi, PAS2, and PAS3 result in products shown. Identity of PAS sites was confirmed by sequencing. (C) Northern blots of total RNA from JSL1 cells grown under indicated conditions were hybridized to oligonucleotides probes specific for a region of exon 14 upstream of both PAS2 and -3 (Left, E14, detects 3′UTRs A–D), or the 5′ end of intron 13 (right, I, detects 3′UTRs A, C, and E). Position where mRNA E would be detected is marked in gray.

