Fig. 5.
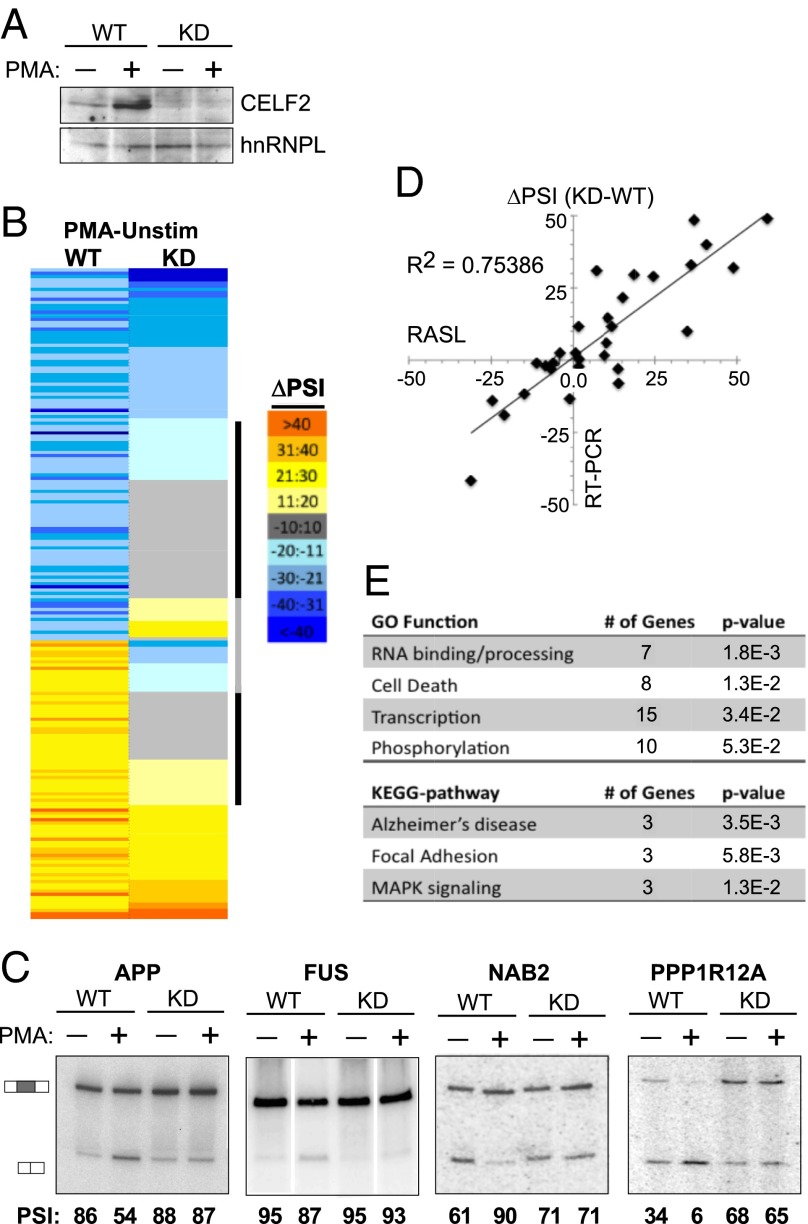
Increased CELF2 expression drives a network of activation-induced alternative splicing events in Jurkat cells. (A) Western blot showing CELF2 depletion in JSL1 cells expressing a shRNA targeting CELF2, relative to wild-type JSL1 cells. Expression of CELF2 was assayed in both unstimulated (−PMA) and stimulated (+PMA) conditions. hnRNP L is used as a loading control. (B) Heat map of the ∼200 exons that exhibit a change in inclusion of >10 (P < 0.05) upon PMA stimulation in wild-type JSL1 cells, and the corresponding change in PSI upon PMA stimulation in the CELF2-depleted cells. Color scale is indicated to the right. Exons were sorted first by the directionality of PMA-induced change in wild-type cells and then each category (enhanced or repressed exons) was sorted for the extent of PMA-induced splicing change in the CELF2-depleted cells. Black bar indicates those exons for which CELF2 depletion has a significant effect on PMA-induced splicing regulation; gray bar indicates those exons for which CELF2 depletion switches the directionality of the PMA response in splicing. (C) Representative RT-PCR validations of CELF2-dependent stimulation-induced splicing events identified by the RASL-Seq data. Percent inclusion values shown are the average of at least three independent experiments. (D) Graphic comparison of ∼30 RASL-calculated changes in exon inclusion upon PMA stimulation (x axis) versus change in exon inclusion confirmed by RT-PCR. (E) Enriched Gene Ontology and Kyoto Encyclopedia of Genes and Genomes categories within the CELF2-dependent genes compared with the total ∼200 genes regulated by PMA. Analysis was done using DAVID (david.abcc.ncifcrf.gov).

