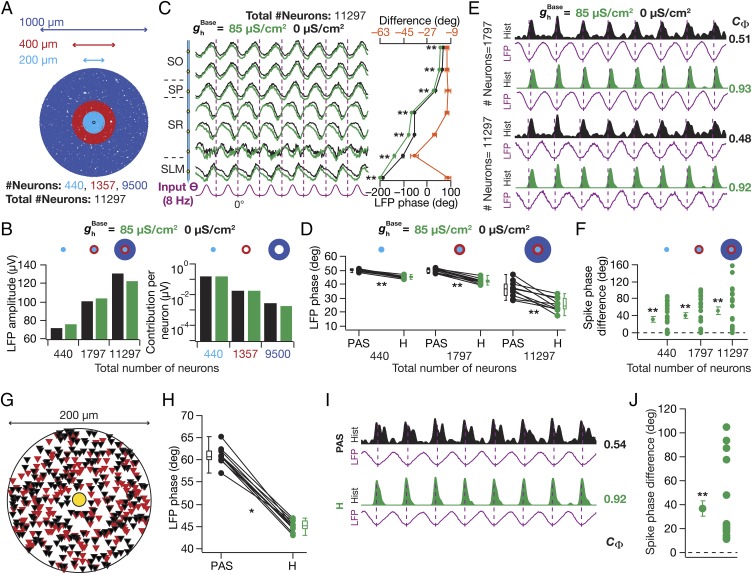
Fig. 3.
HCN-channel–induced changes in LFP and spike phases were invariant to changes in neuropil size and to morphological heterogeneity. (A) Three neuropils of different sizes, used for analyses presented in B–F, depicted with the distribution of neurons. (B, Left) SP LFP amplitude computed in the presence ( = 85 µS/cm2) and in the absence ( = 0 µS/cm2) of HCN channels, for three different neuropil sizes. (B, Right) Per neuron contribution to the LFP amplitude computed with = 0 µS/cm2 and 85 µS/cm2 for the three annuli (A). (C, Left) Normalized LFP traces (1 s) for different strata with = 0 µS/cm2 and 85 µS/cm2 for the largest (1,000 µm diameter) neuropil. (C, Right, Bottom axis) LFP phase with reference to the excitatory input θ (mean ± SEM, 10 cycles) for corresponding traces in C, Left. (C, Right, Top axis) Strata-matched phase difference between LFPs obtained with = 85 µS/cm2 and 0 µS/cm2. (D) LFP phase with reference to the excitatory input θ for three different neuropil sizes computed in the absence (PAS) and the presence (H) of HCN channels. Note the increased variability in the LFP phases (computed across cycles) with increase in neuropil size, a consequence of increased jitter in LFP traces with increase in neuropil size (Fig. S2). (E) Population spike-time histograms (1 s) with corresponding SP LFP for different neuropil sizes for = 0 µS/cm2 and 85 µS/cm2. (F) For three neuropil sizes, cycle-matched difference between spike phases obtained with = 85 µS/cm2 and with = 0 µS/cm2, for 24 different neurons (mean ± SEM). (G) Distribution of 440 neurons with n123 (red, Nn = 214) and ri04 (black, Nn = 226) morphological reconstruction, used for the analyses in H–J. (H) SP LFP phase with reference to input θ (mean ± SEM, 10 cycles), computed in the absence (PAS) and the presence (H) of HCN channels. (I) Population spike-time histograms (1 s) with corresponding SP LFP. (J) Cycle-matched difference between spike phases obtained in the presence and in the absence of HCN channels, for 22 different neurons (mean ± SEM). (C, D, and H) *P < 0.05, **P < 0.005 (Wilcoxon signed rank test). (F and J) **P < 0.005 (Student’s t test on the null hypothesis of no spike-phase difference).

