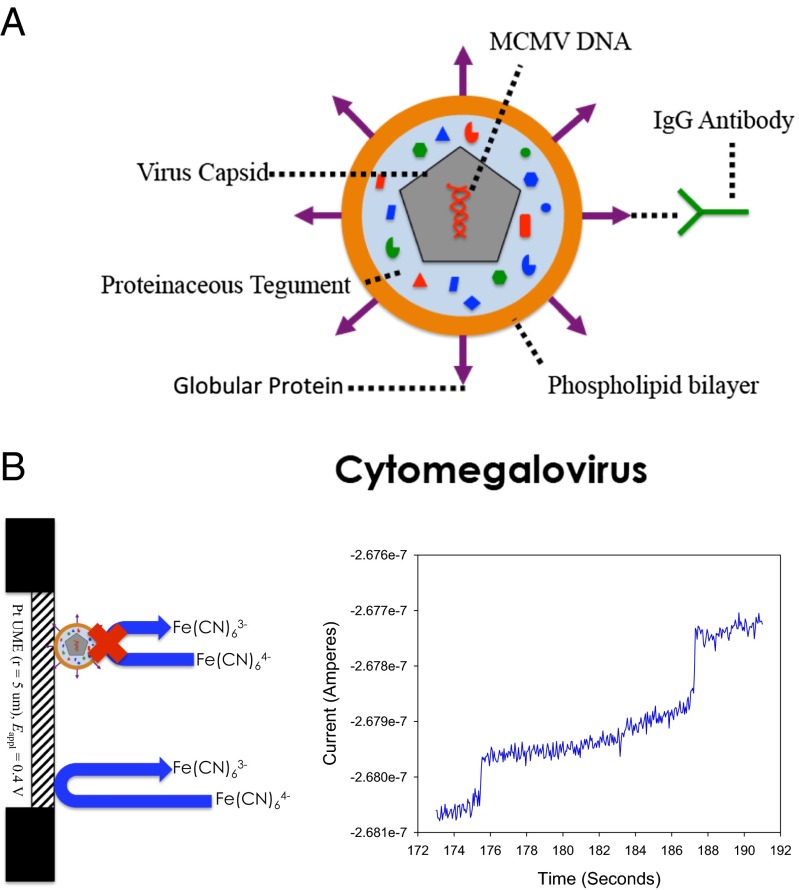
Fig. 1.
(A) Schematic representation of a CMV virion. The antibody used in these studies is specific for the gB protruding from the phospholipid bilayer surface. (B) Typical blocking response. Steps in the i–t curve represent individual adsorption events of MCMV onto the electrode surface. MCMV is blocking 500 mM KFCN at a 10-μm Pt UME, where Eappl = +0.4 V vs. Ag/AgCl.

