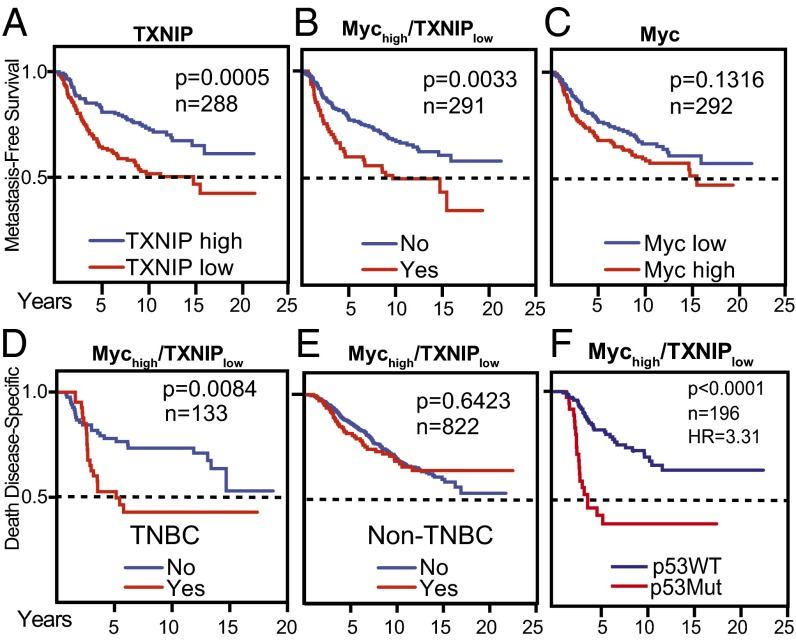
Fig. 5.
Low TXNIP expression and a Mychigh/TXNIPlow gene-expression signature correlate with poor patient outcome. Kaplan–Meier plots indicate the clinical outcomes for the gene-expression patterns given at the top of each panel. For TXNIP and Myc, high expression indicates expression above the mean, calculated across all samples. Conversely, low expression indicates expression below the mean. Mychigh/TXNIPlow indicates Myc expression above the mean in combination with TXNIP expression below the mean. n indicates the number of patient samples evaluated in each analysis. (A–C) Data available from the Netherlands Cancer Institute were analyzed (24). (D–F) Clinical outcomes for the Mychigh/TXNIPlow signature were evaluated in the METABRIC dataset (41). (D and E) The signature was evaluated in TNBCs (D) and non-TNBCs (E). (F) The Mychigh/TXNIPlow signature was correlated with clinical outcome based on p53 mutation status. In F, the 95% confidence interval of the hazard ratio is 1.91–5.70. P values were calculated using the Mantel–Cox log-rank test.

