
Fig. 3.
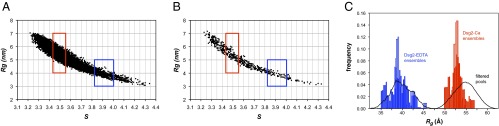
Pool filtering analysis. Plots of Rg vs. sedimentation coefficients (s) as calculated with SoMo for the Ranch model pool (A) and the TAMD model pool (B). Dots represent the pairwise values for each individual model generated. The range of experimentally determined values for s (±1σ) is shown as red boxes for Dsg2-Ca and blue boxes for Dsg2-EDTA. (C) Rg distribution of EOM ensembles for the filtered subsets generated by Ranch (solid bars) and by TAMD with CNS (open bars).