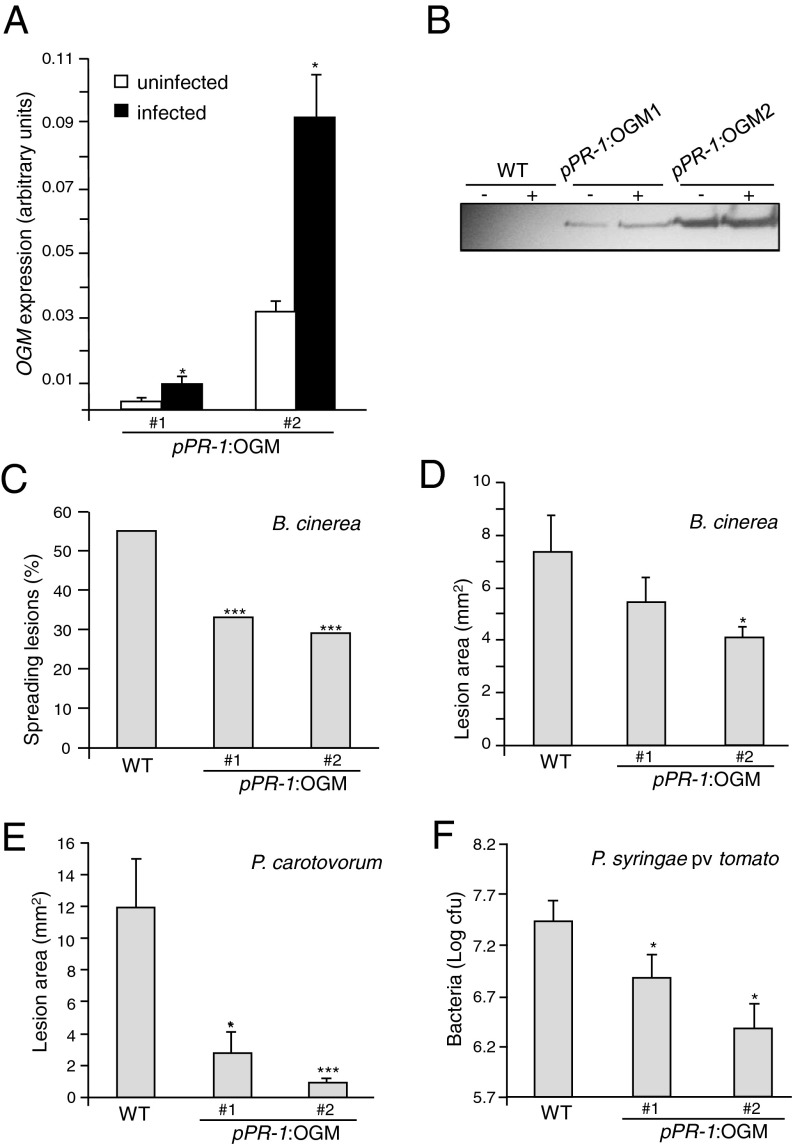
Fig. 4.
Increased resistance of plants expressing a pathogen-inducible OGM (PGIP–PG chimera). (A–D) pPR-1:OGM lines 1 and 2 were inoculated with B. cinerea. OGM transcript (A) and protein (B) levels were analyzed at 0 (−) and 48 h postinfection (hpi) (+). Bars, average ± SD, n = 3. (C) Percentage of spreading lesions (n > 60 in four combined independent experiments) and (D) average lesion area ± SE (n > 12) at 72 hpi. (E) Average lesion area ± SE, n > 12, after P. carotovorum infection. (F) P. syringae pv. tomato DC3000 growth (average ± SE, n > 6) in wild-type (WT) and transgenic plants at 72 hpi. *P < 0.05; ***P < 0.01, Fischer’s exact test (C) or Student’s t test (D–F). All experiments were repeated at least twice with similar results.

