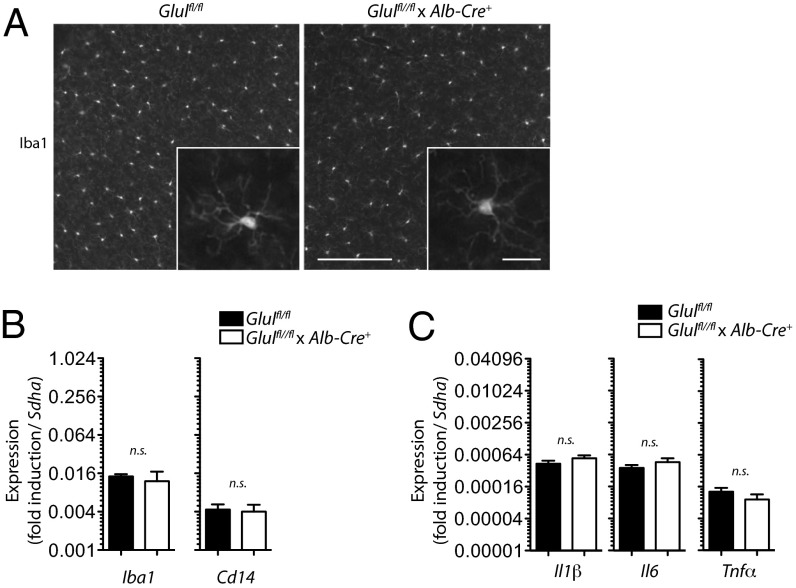
Fig. 5.
Microglia activation marker and proinflammatory cytokine mRNA expression in the cerebral cortex of WT and Glulfl/fl × Alb-Cre+ mice. (A) Detection of Iba1 in mouse cerebral cortex by wide-field fluorescence microscopy. One representative immunofluorescence analysis of three is shown. (Scale bars: 200 μm; Inset, 20 μm.) mRNA expression levels in mouse cerebral cortex by RT-PCR of Iba1 and CD14 (B, n = 3) or IL-1β, I-L6, or TNF-α (C, n = 8 for Glulfl/fl mice and n = 6 of for Glulfl/fl × Alb-Cre+ mice) are shown. mRNA expression levels of Iba1, CD14, IL-1β, IL-6, or TNF-α were normalized to succinate dehydrogenase complex subunit A (SDHA) mRNA levels.

