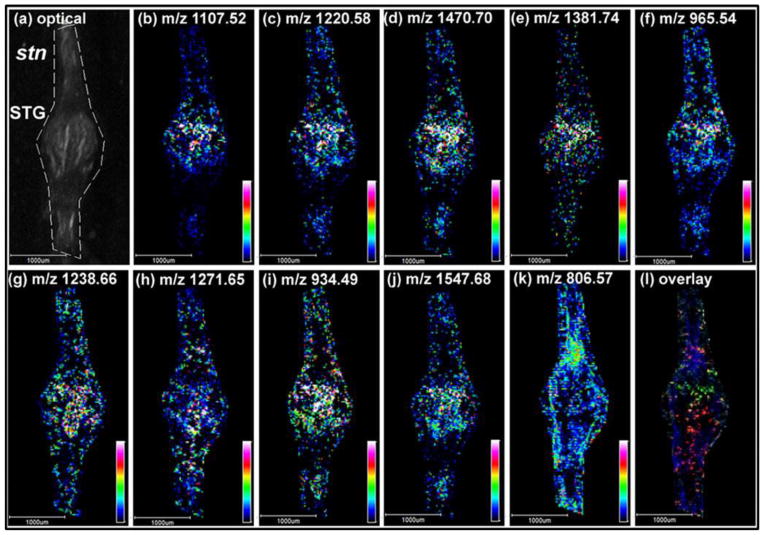
Figure 4.
Representative MSI results of the neuropeptide distributions in Callinectes sapidus STG by MALDI TOF/TOF. (a) An optical image of the STG subjected to subsequent MSI acquisiton. Nine neuropeptides from five different families were shown above. B-type ASTs: (b) AGWSSMRGAWa (m/z 1107.52), (c) SGDWSSLRGAWa (m/z 1220.58), and (d) VPNDWAHFRGSWa (m/z 1470.70). SIFamide: (e) GYRKPPFNGSIFa (m/z 1381.74). RFamides: (f) NRNFLRFa (m/z 965.54), (g) SQPSKNYLRFa (m/z 1238.66), and (h) pQDLDHVFLRFa (m/z 1271.64). CabTRP 1a: APSGFLGMRa (m/z 934.49). Orcokinin: NFDEIDRSSFGFN (m/z 1547.68). For comparison, the distribution of a lipid PC (38:6) (m/z 806.57) is shown in (k). (l) is an overlaid image of (c), (h), and (k), displayed in green, red, and blue, respectively. Adapted with permission from Ref. [86].

