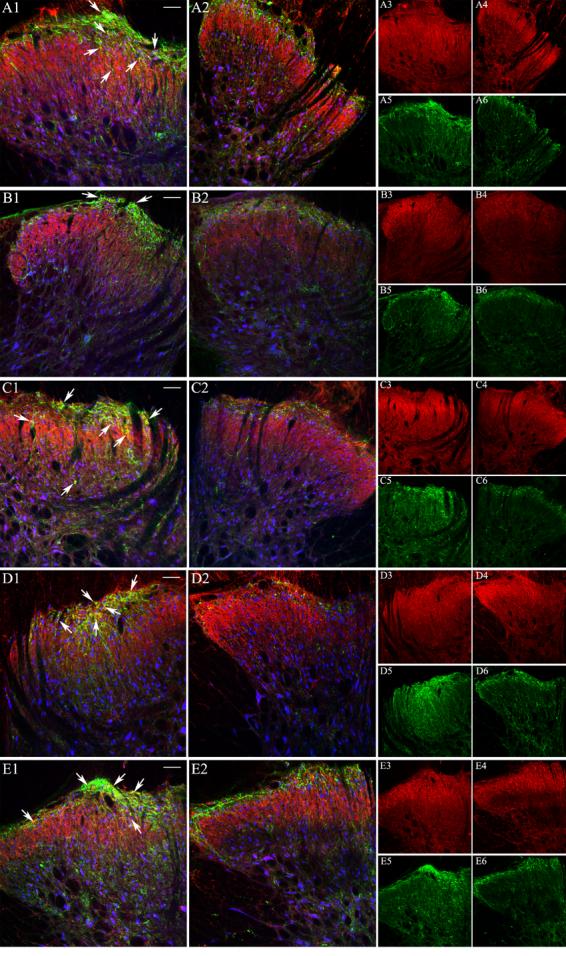
Figure 2.

Confocal microscopy images depicting immunofluorescence labeling in control (panels A1, B1, C1, D1, and E1) and IT sP-SAP (saporin-substance P conjugate) treated (panels A2, B2, C2, D2, and E2) rats following binding with anti-nAChR subunit antibodies (in red), anti-NK1 receptor (in green) and anti-NeuNB (in blue). In panel pairs A1 and A2, B1 and B2, C1 and C2, D1 and D2 and E1 and E2, red color represents staining with anti-α3, anti-α4, anti-α5, anti-β2 and anti-β4 subunit antibodies, respectively. Panel pairs A3 and A4, B3 and B4, C3 and C4, D3 and D4, and E3 and E4 are identical to panels A1 and A2, B1 and B2, C1 and C2, D1 and D2, and E1 and E2, respectively except they represent fluorescence labeling by the anti-nAChR subunit only. Similarly, Panel pairs A5 and A6, B5 and B6, C5 and C6, D5 and D6, and E5 and E6 represent fluorescence labeling by anti-NK1 receptor antibody. White bars represent 50 μm and 100 μm for left two columns and right two columns of panels, respectively. The area of the spinal cord photographed is represented by the rectangular box on the cartoon of the cross-section of lumbar spinal cord as shown in Figure 3.
