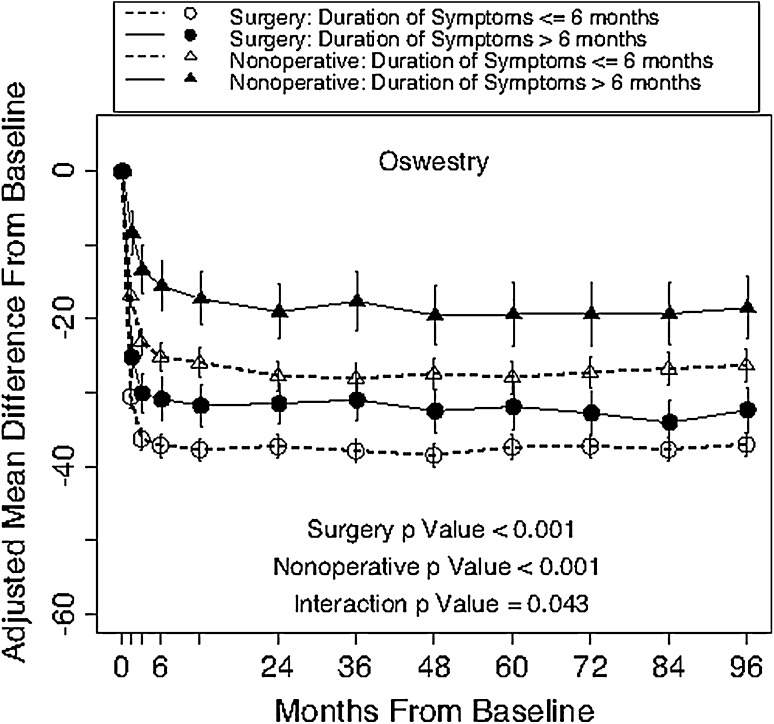
Fig. 3.
Change scores in the ODI over time are displayed according to work status. The surgery p value compares working, other, and disabled statuses among surgery patients. The nonoperative p value compares working, other, and disabled statuses among nonoperative patients. The interaction p value compares the treatment effect (surgery versus nonoperative) among working, other, and disabled statuses. All p values are time-weighted averages over 8 years (ie, area under the curve).

