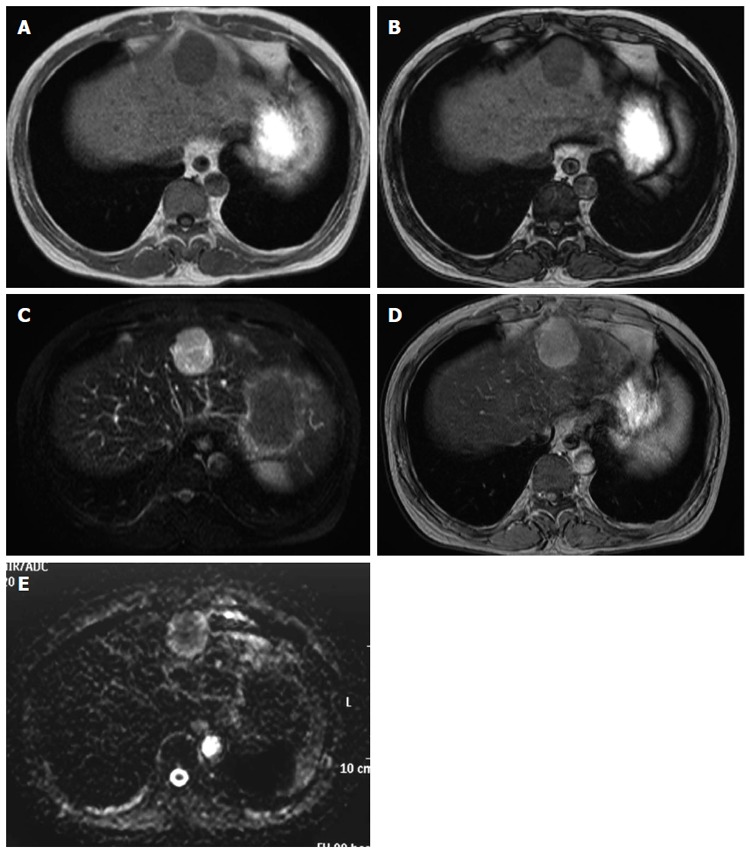
Figure 2.

Magnetic resonance imaging of the liver. A magnetic resonance imaging (MRI) examination was performed on a 1.5 T Achieva Philips device. T1-weighted image (WI): FOV 350, matrix 256 × 204, slice thickness 8 mm, TR 147 ms, TE 2.3/4.6 ms, flip angle 80 degrees; T2-WI: FOV 350, matrix 240 × 196, slice thickness 8 mm, TR 3300 ms, TE 90 ms; T2*-WI: FOV 350, matrix 432 × 346, slice thickness 8 mm, TR 186 ms, TE 8.7 ms, flip angle 60 degrees; Diffusion-WI: FOV 350, matrix 128 × 102, slice thickness 8 mm, TR 1385 ms, TE 70 ms. A: The mass showed ill-defined low signal intensity on the T1-WI; B: There were no decreases in signal intensities in the out-of-phase (B) and in-phase (A) images; C: The mass showed high signal intensity on the T2-WI. The weakly enhanced center of the mass, as shown on computed tomography, was visualized as high signal intensity on the T2-WI, very similar to that observed in the entire mass; D: The mass was also visualized as high signal intensity on the T2*-WI after administration of superparamagnetic iron oxide; E: The mass showed high signal intensity on the diffusion-WI. The apparent diffusion coefficient was 1.491 × 10⁻³ mm2/s.
