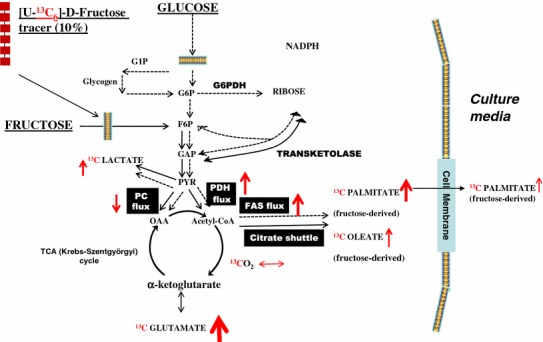
Fig. 6.

Schematic of the 13C labeled fructose-derived metabolites in adipocytes. Adipocytes were exposed to 0.1, 0.5, 1, 2.5, 5, 7.5 or 10 mM fructose in a medium containing a baseline amount of 5 mM glucose from the initiation of differentiation for 8 days (differentiating adipocytes) or 16 days (differentiated adipocytes). 10 % of fructose was supplied as [U-13C6]-fructose for a period of 48 h before harvest. The red arrows indicate the specific fold changes in response to 5 mM fructose treatment compared to the lowest treatment of 0.1 mM fructose (13CO2, +1.15×; extracellular [13C]-glutamate, +7.2×; PC flux, −0.32; PDH flux, +3.97×; intracellular [13C]-palmitate, +4.8×; extracellular release of [13C]-palmitate −1.67×; FAS flux, +4.33×; intracellular [13C]-oleate, +2.56×; extracellular [13C]-lactate, +3×). G1P glucose 1-phosphate, G6P glucose 6-phosphate, G6PDH glucose 6-phosphate dehydrogenase, F6P fructose 6-phosphate, FAS fatty acid synthase, GAP glyceraldehyde 3-phosphate, PYR pyruvate, OAA oxaloacetate. ↑ represents increasing fold change; ↓ decreasing fold changes and the thickness of the arrow represents intensity of the fold change
