
Fig. 5.
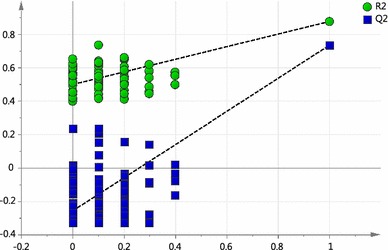
Validation plot obtained from permutation test (n = 100) for the OPLS-DA model of PCOS versus luteal phase. R2 is the explained variance, and Q2 is the predictive ability of the model. The Q2-intercept value was less than 0.05 shows that the model is statistically sound and high predictability of the model is not because of over-fitting data