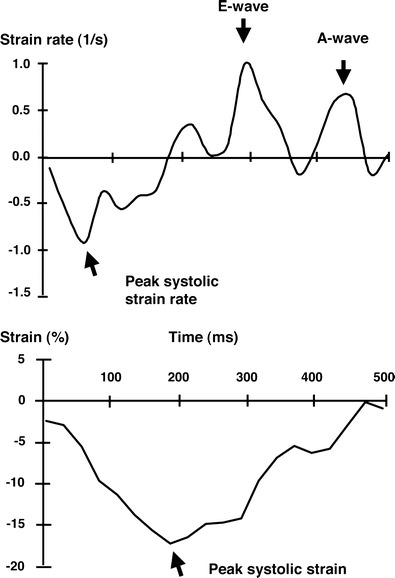
Fig. 3.

Regional systolic and diastolic function can be quantified from tagged cardiac MR images. The figures show left ventricular strain rate and strain across the cardiac cycle. The “E-wave” reflects the strain rate associated with early diastolic filling. The “A-wave” reflects the strain rate associated with atrial contraction. Strain represents the percent change in the dimension of the myocardial (roughly percent thickening of the wall). Strain rate is the rate of change if strain. (Reproduced with permission from: Edvardsen T, Detrano R, Rosen BD, Carr JJ, Liu K, Lai S, Shea S, Pan L, Bluemke DA, Lima JA. Coronary artery atherosclerosis is related to reduced regional left ventricular function in individuals without history of clinical cardiovascular disease: the Multiethnic Study of Atherosclerosis. Arterioscler Thromb Vasc Biol. 2006;26(1):206–211) [37]
