
Figure 4.
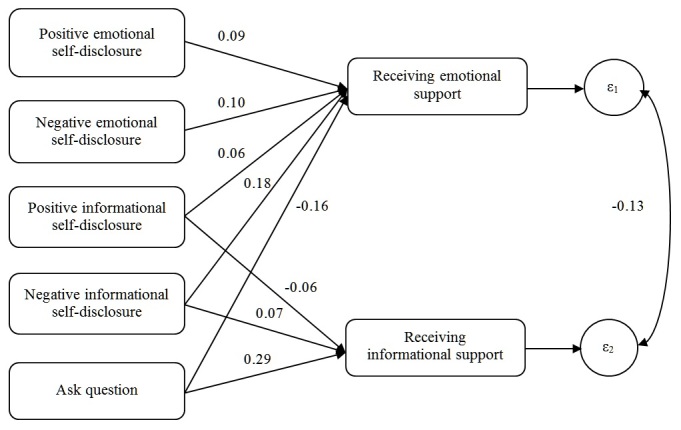
Path model showing the analysis of the social support communication process based on machine-coded data. ε1 and ε2 indicate error terms. All P values <.001.
Official websites use .gov
A
.gov website belongs to an official
government organization in the United States.
Secure .gov websites use HTTPS
A lock (
) or https:// means you've safely
connected to the .gov website. Share sensitive
information only on official, secure websites.
Path model showing the analysis of the social support communication process based on machine-coded data. ε1 and ε2 indicate error terms. All P values <.001.