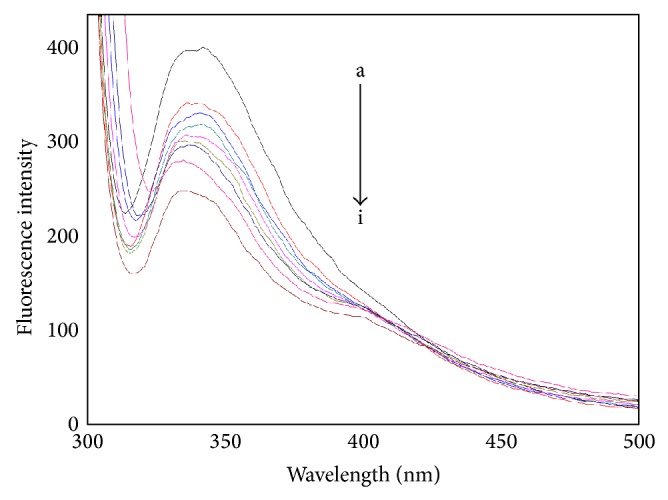
Figure 2.

The fluorescence emission spectra of the CIT-HSA system. The concentration of HSA was 1.5 μM while the CIT concentration corresponding to 0, 1.67, 3.33, 5.0, 6.67, 8.33, 10.0, and 13.3 μM is from a to i, respectively. Tris buffer, pH = 7.4, T = 297 K, λ ex = 295 nm.
