
Figure 4.
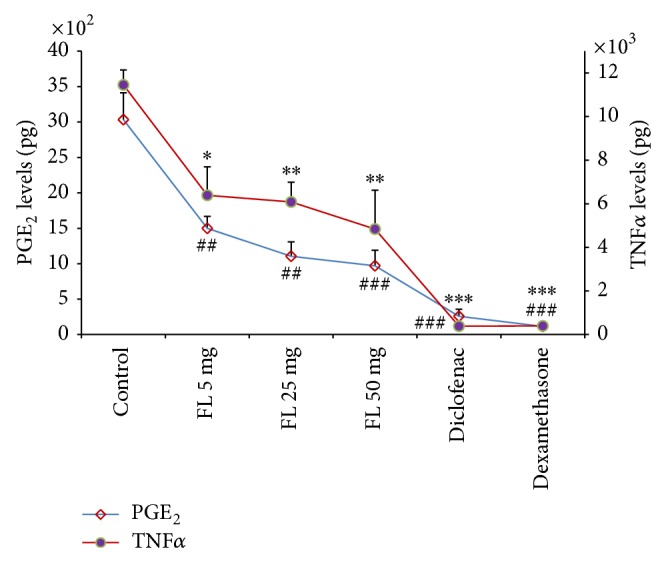
The effects of methanolic extract of Ficus carica leaves on PGE2 and TNFα levels. Values are mean ± SEM shown by vertical bars. Asterisks indicate significant change from control; ∗ P < 0.050, ∗∗ P < 0.010, and ∗∗∗ P < 0.001; # P < 0.050 and ## P < 0.010; FL: Ficus carica.