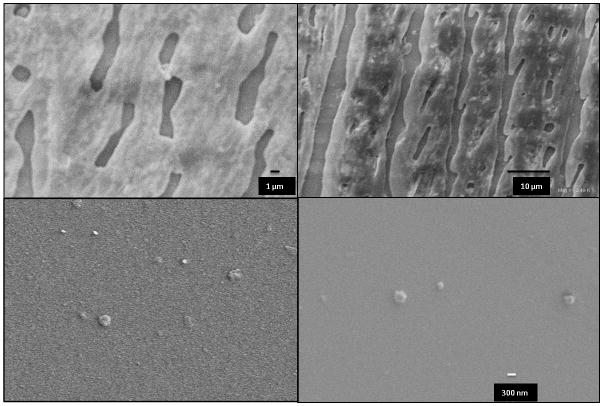
Figure 2. Scaning Electron Microscopy analysis for size and conformation decetion.
Left and right columns belong to 6XK and 6XT, respectively. Top row of SEM images taken before the polyplex formation showing film-like structures. Protein concentration was 1 mg/mL. Bottom row shows polyplex formation upon addition of pDNA with a ratio of N/P 1. Protein concentration was 0.1 mg/mL. Scale bar is 300 nm.

