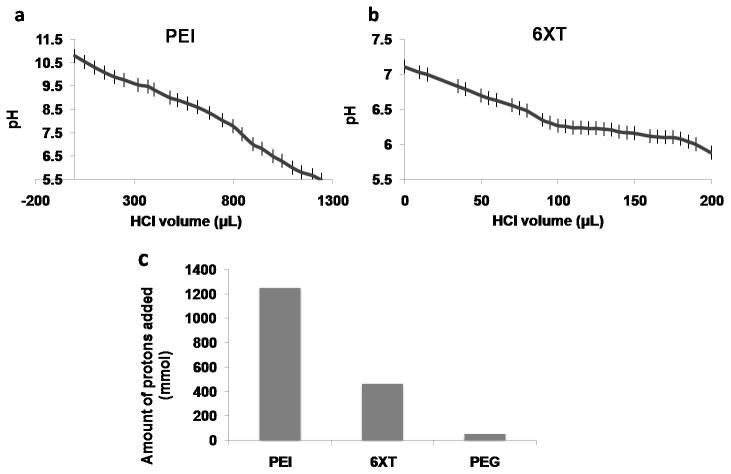
Figure 3. Proton Buffer Analysis.
pH response curve for PEI (a) and 6XT (b) by acid-base titration. Buffering capacity of the recombinant polymer was prominent between pH 6.27 and 6.08. Amount of proton required to change the pH of the media was calculated and compared for PEI, PEG and recombinant polymer (c).

