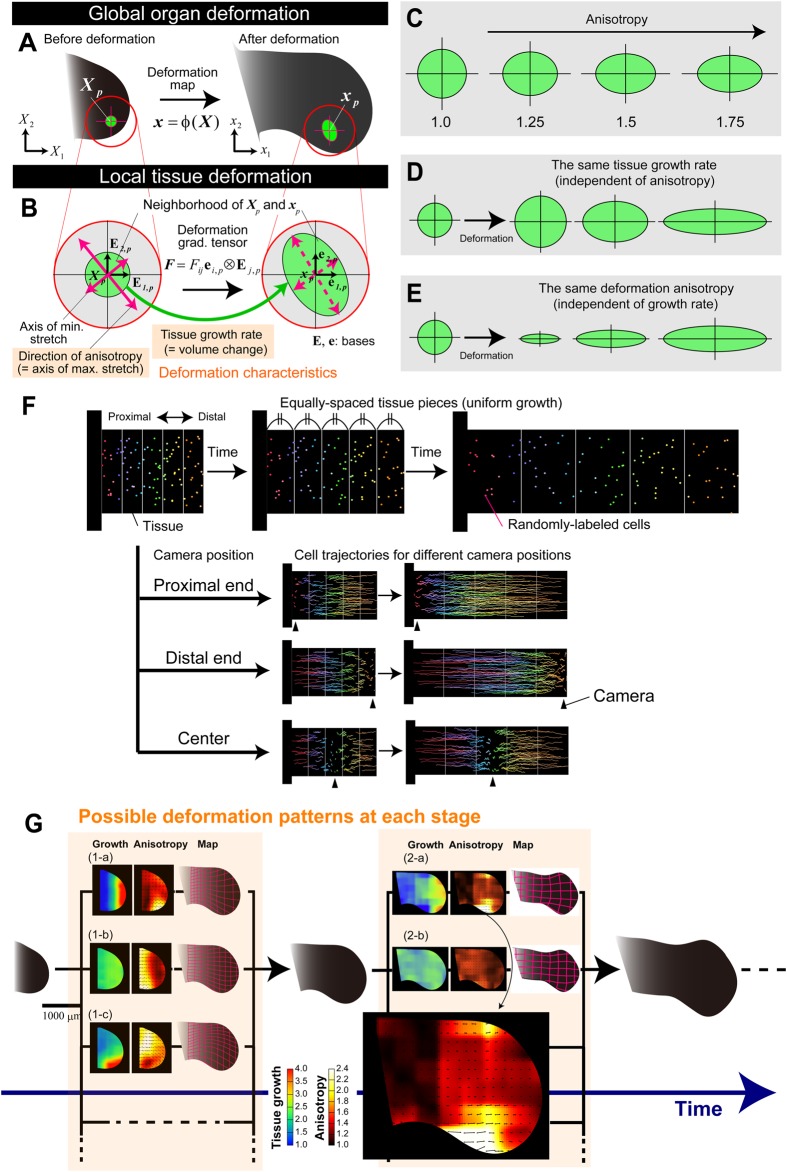
Fig. 1.
Tissue-level characterization of deformation dynamics. Global organ deformation is defined by map ϕ (A), and local tissue deformation is defined by the deformation gradient tensor F (B). Tissue growth rate and deformation anisotropy are two key characteristics. (C-E) Examples of local tissue deformation, with different values for deformation anisotropy, identical tissue growth rate and identical deformation anisotropy, respectively. (F) Cell trajectory or velocity in a growing tissue appears different, depending on the position of the camera, even if tissue deformation dynamics are identical. Here, the case of spatially uniform growth is shown. (G) Possible scenarios for deformation dynamics at each stage (artificially generated by computer simulations). For each stage, different deformation dynamics, producing the same morphology, are possible. The heat maps indicate spatial patterns of tissue growth rate (left) and deformation anisotropy (right). Black arrows represent the orientation of the principal stretch at each position [see the higher magnification view in case (2-b) for an example]. In case (1-a), the morphology in the middle panel is achieved by distally biased volume growth and anisotropy of tissue deformation along the proximo-distal axis. In case (1-b), spatially uniform volume growth and proximally biased anisotropic tissue deformation generate the same morphology, and in case (1-c), the same morphology is also realized by a more complex deformation pattern with posteriorly biased tissue growth. The deformation dynamics can change with developmental stage [cases (2-a) and (2-b)].

