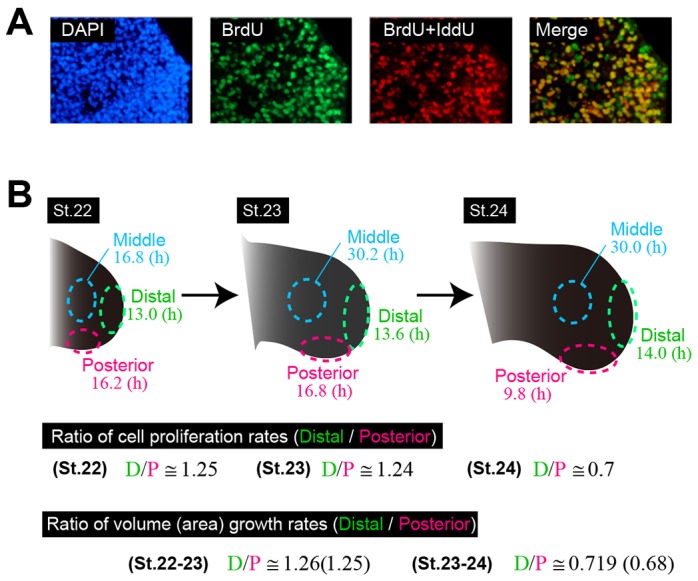
Fig. 4.

Spatial patterns of tissue growth rate can be explained by the spatial heterogeneity of cell cycle time. (A) BrdU/IddU incorporation at the distal side at stage 23. (B) Cell-cycle time was measured at three locations at stages 22, 23 and 24. The ratio of cell proliferation rates (1/cell cycle time) between distal and posterior regions is quantitatively consistent with that of tissue-level volume (or area) growth rates. For calculating the cell cycle time at each location and at each stage, 600 cells from three embryos were used.
