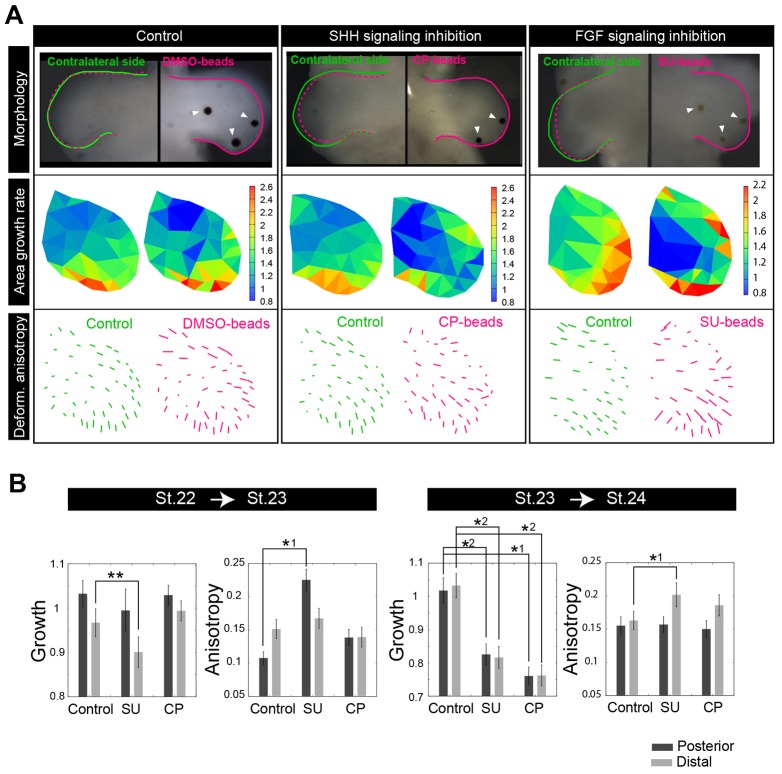
Fig. 6.
Contributions of SHH and FGF signaling to deformation characteristics. (A) Typical examples of effects of bead implantation; from top to bottom, morphology at 12 h after implanting beads, spatial patterns of area growth rate and deformation anisotropy are shown. The area growth rate and deformation anisotropy are calculated for both beads and control. From left to right, the results for implanting beads soaked with DMSO (control), cyclopamine (CP) and SU5402 (SU) are shown. On the contralateral side (left limb bud), no beads were implanted. (B) Summary of the effects of inhibiting SHH and FGF signaling. For two different time intervals (stage 22-23 and stage 23-24) and different regions (posterior and distal), the change in tissue growth rate and the deformation anisotropy are calculated. Error bars indicate s.e. *1: P<0.05 (Welch's t-test); *2: P<0.05 (Student's t-test); **: P<0.1 (Student's t-test).

