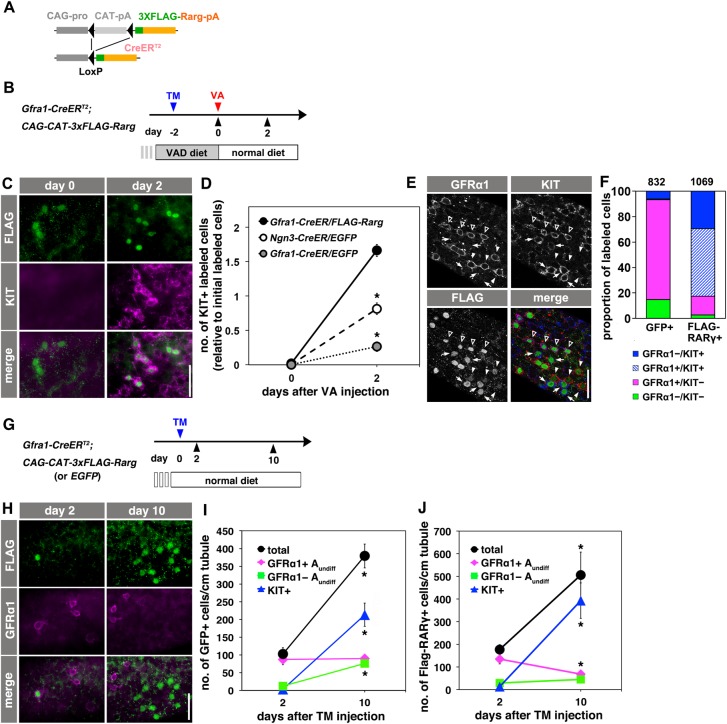
Fig. 5.
Ectopic RARγ expression by GFRα1+ spermatogonia. (A) The CAG-CAT-3xFLAG-Rarg transgene. When CAT between the loxP sites is deleted by TM-activated Cre, FLAG-tagged RARγ is constitutively expressed under the control of the CAG promoter. (B) Experimental design of the fate analysis of GFRα1+ cells with enforced FLAG-RARγ expression upon VA readministration in VAD mice, as shown in C-F. Gfra1-CreERT2; CAG-CAT-3xFLAG-Rarg transgenic mice were maintained in VAD and VA was administered 2 days after TM injection, as indicated. Testes were then processed for IF. (C,D) IF images of whole-mount seminiferous tubules of the mice described above, 2 days after VA injection, stained for FLAG-RARγ (green) and KIT (magenta) (C), and cell number relative to the number of initial induced cells (D). Data for GFP-labeled NGN3+ and GFRα1+ cells are reproduced from Fig. 2C and Fig. 3C, respectively, for comparison. The mean±s.e.m. value of three testes is shown. *P<0.003 (t-test), compared with the values of FLAG-RARγ+ GFRα1+ cells at day 2. (E,F) Representative confocal images of the same field of whole-mounts of seminiferous tubules of mice treated as described above, at 2 days after VA injection; staining was performed for GFRα1, KIT and FLAG (E). Open arrowheads, white arrowheads and small arrows indicate FLAG+ cells that are GFRα1+/KIT+, GFRα1+/KIT− and GFRα1−/KIT+, respectively. (F) Quantitation of GFP+ and FLAG-RARγ+ cells showing different patterns of GFRα1 and KIT expression in Gfra1-CreERT2; CAG-CAT-EGFP and Gfra1-CreERT2; CAG-CAT-3xFLAG-Rarg mice, respectively. Cell numbers are shown above each bar. (G) Experimental design of the fate analysis of GFRα1+ cells with enforced FLAG-RARγ expression under normal conditions, as shown in H-J. Gfra1-CreERT2; CAG-CAT-3xFLAG-Rarg transgenic mice were pulsed with TM at 13-17 weeks of age, and after 2 and 10 days their testes were processed for IF. (H) IF images of whole-mount seminiferous tubules 2 and 10 days after TM injection, stained for FLAG-RARγ and GFRα1. (I,J) Numbers of GFRα1+ Aundiff (magenta), GFRα1− Aundiff (green), KIT+ (blue) spermatogonia and total cells (black) in either GFP-labeled (I) or FLAG-RARγ-expressing (J) cells of Gfra1-CreERT2; CAG-CAT-EGFP and Gfra1-CreERT2; CAG-CAT-3xFLAG-Rarg mice, respectively, following the schedule shown in G. The mean±s.e.m. of four (I) and three (J) testes are shown. *P<0.05 (t-test), compared with the values on day 2. Scale bars: 50 μm.

