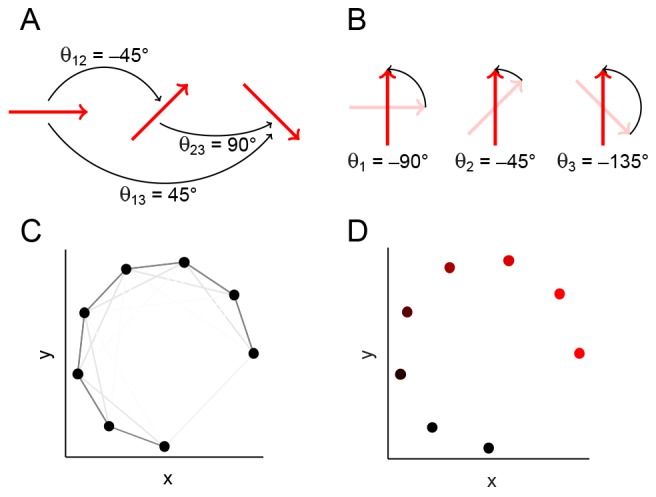
Fig. 2.

Schematic illustrating angular synchronization and diffusion maps. (A) A set of vectors, each in a different orientation. The pairwise alignment angles are indicated. (B) The vectors from A, each rotated about their midpoint so that the set is globally aligned. Note that the chosen rotation angles are consistent with the pairwise alignments in A: the difference between a pair of angles in B is the same as the pairwise angle in A. (C) Data points (black) that lie on a 1D nonlinear curve in two dimensions. Each pair of points is connected by an edge, and the edge weight is related to the Euclidean distance between the points through a Gaussian kernel (see algorithms in the supplementary material), so that pairs of data points that are close are connected by darker (‘stronger’) edges. (D) The data in C, colored by the first (non-trivial) eigenvector from the diffusion map computational procedure. The color intensity is monotonic with the perceived curve arc length, thus parametrizing the curve.
