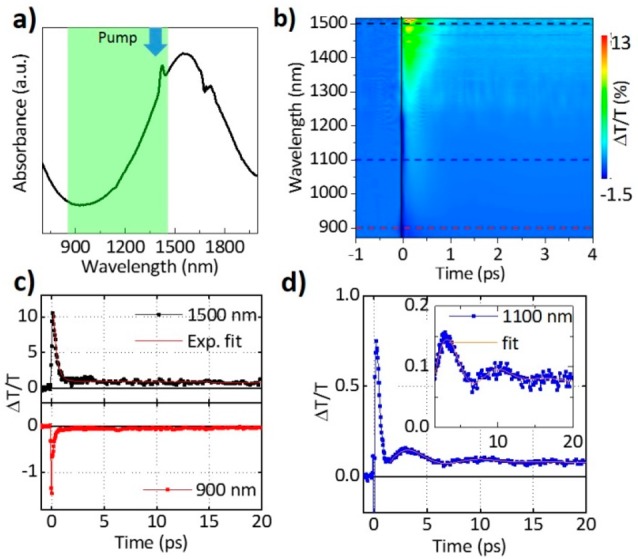
Figure 3.

(a) Steady-state absorption of the Cu3-xP NCs; the arrow indicates the pump wavelength while the probe region is marked in green. (b) Contour plot of the differential transmission versus wavelength (y-axis) and time (x-axis). Horizontal dashed lines in black, blue, and red indicate the wavelength of representative differential transmission decay dynamics as given in (c) at 1500 nm (black curve) together with a biexponential fit (red curve, upper plot), and 900 nm (red curve, lower plot) and (d) at 1100 nm (blue curve) together with a fit to the oscillation as described in the main text (orange curve).
